

Developmental changes in hippocampal shape among preadolescent children
- PMID: 23773912
- PMCID: PMC3836360
- DOI: 10.1016/j.ijdevneu.2013.06.001
Developmental changes in hippocampal shape among preadolescent children
Abstract
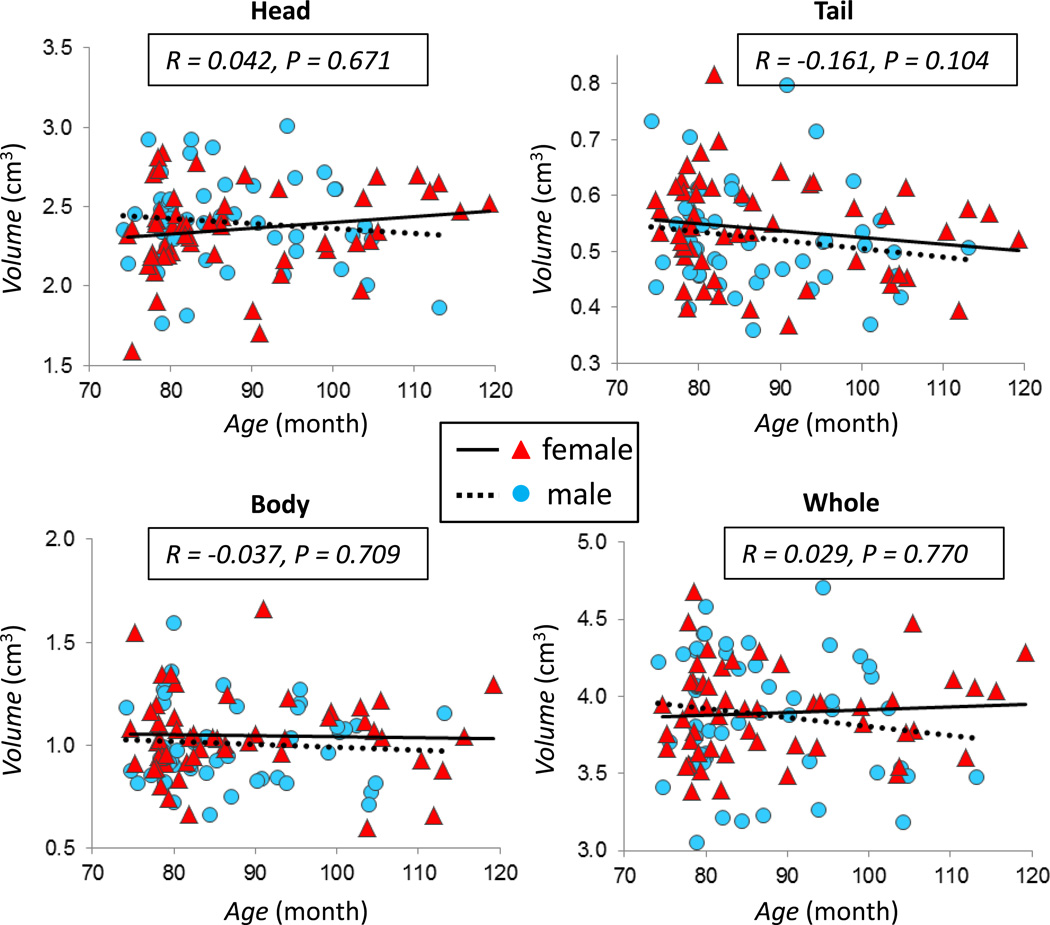
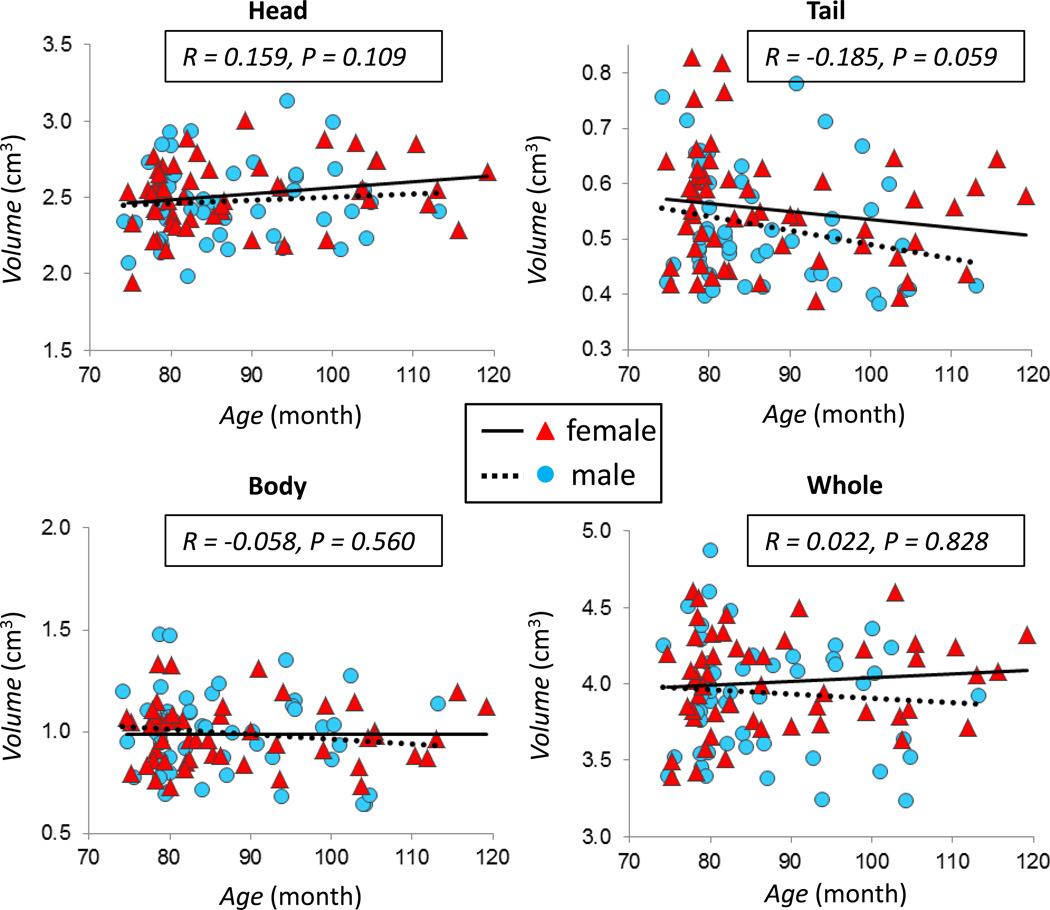
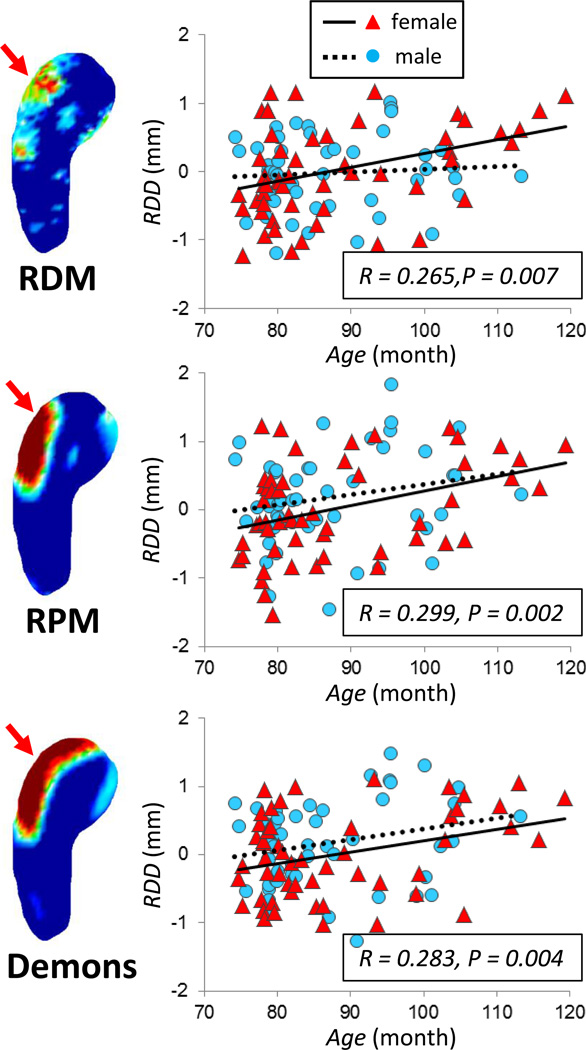
It is known that the largest developmental changes in the hippocampus take place during the prenatal period and during the first two years of postnatal life. Few studies have been conducted to address the normal developmental trajectory of the hippocampus during childhood. In this study shape analysis was applied to study the normal developing hippocampus in a group of 103 typically developing 6- to 10-year-old preadolescent children. The individual brain was normalized to a template, and then the hippocampus was manually segmented and further divided into the head, body, and tail sub-regions. Three different methods were applied for hippocampal shape analysis: radial distance mapping, surface-based template registration using the robust point matching (RPM) algorithm, and volume-based template registration using the Demons algorithm. All three methods show that the older children have bilateral expanded head segments compared to the younger children. The results analyzed based on radial distance to the centerline were consistent with those analyzed using template-based registration methods. In analyses stratified by sex, it was found that the age-associated anatomical changes were similar in boys and girls, but the age-association was strongest in girls. Total hippocampal volume and sub-regional volumes analyzed using manual segmentation did not show a significant age-association. Our results suggest that shape analysis is sensitive to detect sub-regional differences that are not revealed in volumetric analysis. The three methods presented in this study may be applied in future studies to investigate the normal developmental trajectory of the hippocampus in children. They may be further applied to detect early deviations from the normal developmental trajectory in young children for evaluating susceptibility for psychopathological disorders involving hippocampus.
Keywords: AD; Alzheimer's disease; CT; Demons algorithm; FDR; Hippocampal shape analysis; ICBM; IR-SPGR; International Consortium for Brain Mapping; LDDMM; Large Deformation Diffeomorphic Metric Mapping; MNI; MRI; Montreal Neurological Institute; Non-rigid registration; PET; Positron emission tomography; RDD; RDM; ROI; RPM; Radial distance mapping; Robust point matching algorithm; TE; TFE; TI; TR; computed tomography; echo time; false discovery rate; inversion time; inversion-recovery spoiled gradient recalled acquisition; magnetic resonance imaging; radial distance difference; radial distance mapping; region of interest; repetition time; robust point matching; turbo field echo.
Copyright © 2013 ISDN. Published by Elsevier Ltd. All rights reserved.
Figures


Similar articles
-
Evolution of hippocampal shapes across the human lifespan.Hum Brain Mapp. 2013 Nov;34(11):3075-85. doi: 10.1002/hbm.22125. Epub 2012 Jul 19. Hum Brain Mapp. 2013. PMID: 22815197 Free PMC article.
-
Human brain atlas for automated region of interest selection in quantitative susceptibility mapping: application to determine iron content in deep gray matter structures.Neuroimage. 2013 Nov 15;82:449-69. doi: 10.1016/j.neuroimage.2013.05.127. Epub 2013 Jun 12. Neuroimage. 2013. PMID: 23769915 Free PMC article.
-
Locally Linear Diffeomorphic Metric Embedding (LLDME) for surface-based anatomical shape modeling.Neuroimage. 2011 May 1;56(1):149-61. doi: 10.1016/j.neuroimage.2011.01.069. Epub 2011 Jan 31. Neuroimage. 2011. PMID: 21281721
-
Multi-atlas segmentation of the whole hippocampus and subfields using multiple automatically generated templates.Neuroimage. 2014 Nov 1;101:494-512. doi: 10.1016/j.neuroimage.2014.04.054. Epub 2014 Apr 29. Neuroimage. 2014. PMID: 24784800
-
A novel volumetric feature extraction technique with applications to MR images.IEEE Trans Med Imaging. 1997 Aug;16(4):365-71. doi: 10.1109/42.611343. IEEE Trans Med Imaging. 1997. PMID: 9262994 Review.
Cited by
-
Larger hippocampal dimensions in meditation practitioners: differential effects in women and men.Front Psychol. 2015 Mar 6;6:186. doi: 10.3389/fpsyg.2015.00186. eCollection 2015. Front Psychol. 2015. PMID: 25798115 Free PMC article.
-
Acute exposure to a high-fat diet in juvenile male rats disrupts hippocampal-dependent memory and plasticity through glucocorticoids.Sci Rep. 2019 Aug 22;9(1):12270. doi: 10.1038/s41598-019-48800-2. Sci Rep. 2019. PMID: 31439894 Free PMC article.
-
Mapping mesoscale connectivity within the human hippocampus.Neuroimage. 2023 Nov 15;282:120406. doi: 10.1016/j.neuroimage.2023.120406. Epub 2023 Oct 11. Neuroimage. 2023. PMID: 37827206 Free PMC article.
-
Hippocampal Shape Maturation in Childhood and Adolescence.Cereb Cortex. 2019 Aug 14;29(9):3651-3665. doi: 10.1093/cercor/bhy244. Cereb Cortex. 2019. PMID: 30272143 Free PMC article.
-
Development of hippocampal functional connectivity during childhood.Hum Brain Mapp. 2017 Jan;38(1):182-201. doi: 10.1002/hbm.23353. Epub 2016 Sep 1. Hum Brain Mapp. 2017. PMID: 27585371 Free PMC article.
References
-
- Andersen SL. Trajectories of brain development: point of vulnerability or window of opportunity? Neurosci. Biobehav. Rev. 2003;27:3–18. - PubMed
-
- Apostolova LG, Dinov ID, Dutton RA, Hayashi KM, Toga AW, Cummings JL, Thompson PM. 3D comparison of hippocampal atrophy in amnestic mild cognitive impairment and Alzheimer’s disease. Brain. 2006;129:2867–2873. - PubMed
-
- Armstrong JM, Goldstein LH. Manual for the MacArthur Health and Behavior Questionnaire (HBQ 1.0) Chicago: MacArthur Foundation Research Network on Psychopathology and Development Kupfer, D. J. University of Pittsburgh; 2003.
-
- Arnold SE, Trojanowski JQ. Human fetal hippocampal development: I Cytoarchitecture, myeloarchitecture, and neuronal morphologic features. J Comp Neurol. 1996a;367:274–292. - PubMed
-
- Arnold SE, Trojanowski JQ. Human fetal hippocampal development: II. The neuronal cytoskeleton. J Comp Neurol. 1996b;367:293–307. - PubMed
Publication types
MeSH terms
Grants and funding
LinkOut - more resources
Full Text Sources
Other Literature Sources
Medical
