

Noninvasive cardiac activation imaging of ventricular arrhythmias during drug-induced QT prolongation in the rabbit heart
- PMID: 23773986
- PMCID: PMC3787973
- DOI: 10.1016/j.hrthm.2013.06.010
Noninvasive cardiac activation imaging of ventricular arrhythmias during drug-induced QT prolongation in the rabbit heart
Abstract
Background: Imaging myocardial activation from noninvasive body surface potentials promises to aid in both cardiovascular research and clinical medicine.
Objective: To investigate the ability of a noninvasive 3-dimensional cardiac electrical imaging technique for characterizing the activation patterns of dynamically changing ventricular arrhythmias during drug-induced QT prolongation in rabbits.
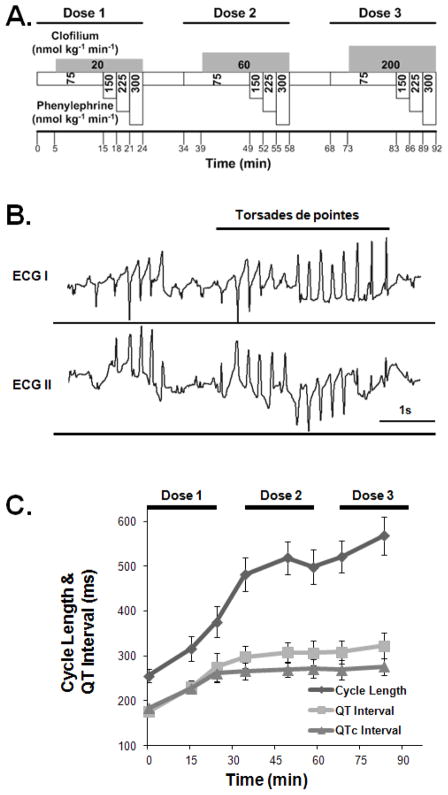
Methods: Simultaneous body surface potential mapping and 3-dimensional intracardiac mapping were performed in a closed-chest condition in 8 rabbits. Data analysis was performed on premature ventricular complexes, couplets, and torsades de pointes (TdP) induced during intravenous administration of clofilium and phenylephrine with combinations of various infusion rates.
Results: The drug infusion led to a significant increase in the QT interval (from 175 ± 7 to 274 ± 31 ms) and rate-corrected QT interval (from 183 ± 5 to 262 ± 21 ms) during the first dose cycle. All the ectopic beats initiated by a focal activation pattern. The initial beat of TdPs arose at the focal site, whereas the subsequent beats were due to focal activity from different sites or 2 competing focal sites. The imaged results captured the dynamic shift of activation patterns and were in good correlation with the simultaneous measurements, with a correlation coefficient of 0.65 ± 0.02 averaged over 111 ectopic beats. Sites of initial activation were localized to be ~5 mm from the directly measured initiation sites.
Conclusions: The 3-dimensional cardiac electrical imaging technique could localize the origin of activation and image activation sequence of TdP during QT prolongation induced by clofilium and phenylephrine in rabbits. It offers the potential to noninvasively investigate the proarrhythmic effects of drug infusion and assess the mechanisms of arrhythmias on a beat-to-beat basis.
Keywords: 3-dimensional; 3-dimensional cardiac electrical imaging; 3D; 3DCEI; BSPM; CC; CL; Cardiac imaging; Cardiac mapping; EAD; ECG; Electrocardiography; LE; LV; PVC; QT prolongation; QTc; RV; RVOT; Rabbit model; TAT; TdP; Torsades de pointes; UFCT; body surface potential map; correlation coefficient; cycle length; early afterdepolarization; electrocardiographic/electrocardiogram; left ventricle/ventricular; localization error; premature ventricular complex; rate-corrected QT; right ventricle/ventricular; right ventricular outflow tract; torsades de pointes; total activation time; ultrafast computed tomography.
© 2013 Heart Rhythm Society. All rights reserved.
Conflict of interest statement
Conflict of Interest Disclosures: Bin He is an inventor of a US Patent for the imaging technique used in this study.
Figures


References
-
- Dessertenne F. La tachycardie ventriculaire a deux foyers opposes variables (in French) Arch Mal Coeur. 1966;59:263–272. - PubMed
-
- El-Sherif N, Caref EB, Yin H, Restivo M. The electrophysiological mechanism of ventricular arrhythmias in the long QT syndrome. Tridimensional mapping of activation and recovery patterns. Circ Res. 1996;79:474–492. - PubMed
-
- Murakawa Y, Sezaki K, Yamashita T, Kanese Y, Omata M. Three-dimensional activation sequence of cesium-induced ventricular arrhythmias. Am J Physiol. 1997;273:H1377–1385. - PubMed
-
- Schreiner KD, Kelemen K, Zehelein J, et al. Biventricular hypertrophy dogs with chronic AV block: effects of cyclosporin A on morphology and electrophysiology. Am J Physiol Heart Circ Physiol. 2004;287:H2891–H2898. - PubMed
-
- Boulaksil M, Jungschleger JG, Antoons G, et al. Drug-induced torsade de pointes arrhythmias in the chronic AV block dog are perpetuated by focal activity. Circ Arrhythm Electrophysiol. 2011;4:566–576. - PubMed
Publication types
MeSH terms
Substances
Grants and funding
LinkOut - more resources
Full Text Sources
Other Literature Sources
