

Review
doi: 10.1038/nrg3457.
Pitfalls of predicting complex traits from SNPs
Affiliations
- PMID: 23774735
- PMCID: PMC4096801
- DOI: 10.1038/nrg3457
Item in Clipboard
Review
Pitfalls of predicting complex traits from SNPs
Nat Rev Genet.
2013 Jul.
Abstract
The success of genome-wide association studies (GWASs) has led to increasing interest in making predictions of complex trait phenotypes, including disease, from genotype data. Rigorous assessment of the value of predictors is crucial before implementation. Here we discuss some of the limitations and pitfalls of prediction analysis and show how naive implementations can lead to severe bias and misinterpretation of results.
Figures
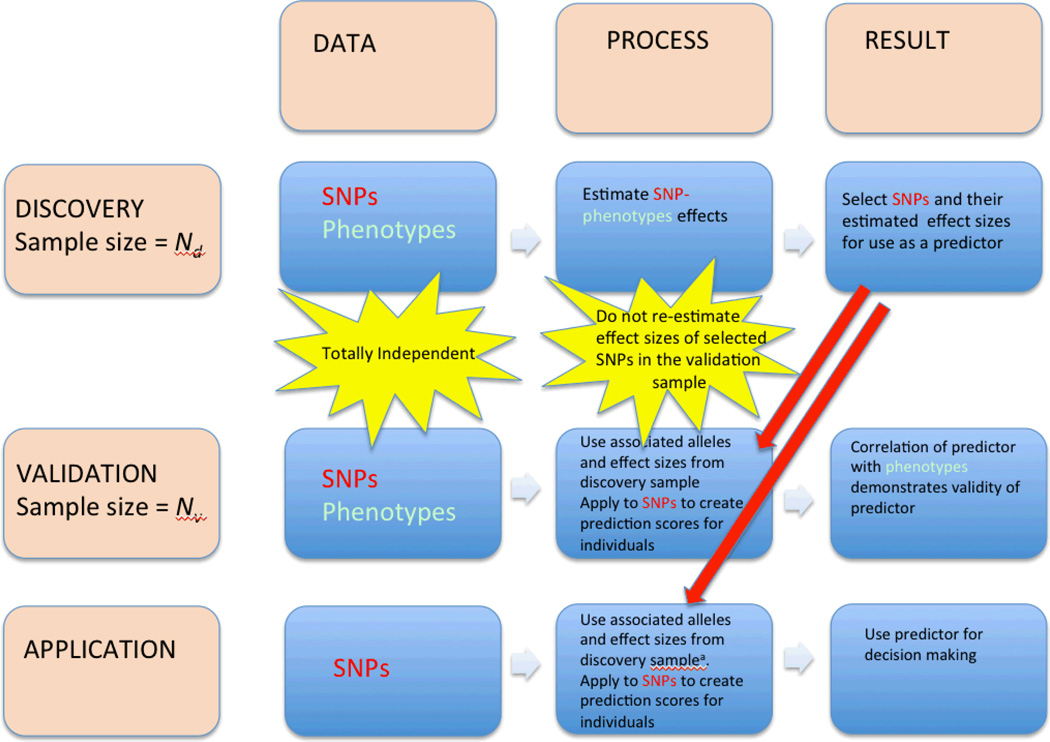
Flowchart of SNP-based prediction analysis. There are three stages for the development of a risk predictor – discovery, validation and application. At each stage data is needed as an input, a process is applied to the data and a result is generated. a. At this stage effect sizes estimated from combined discovery and validation samples can be used.
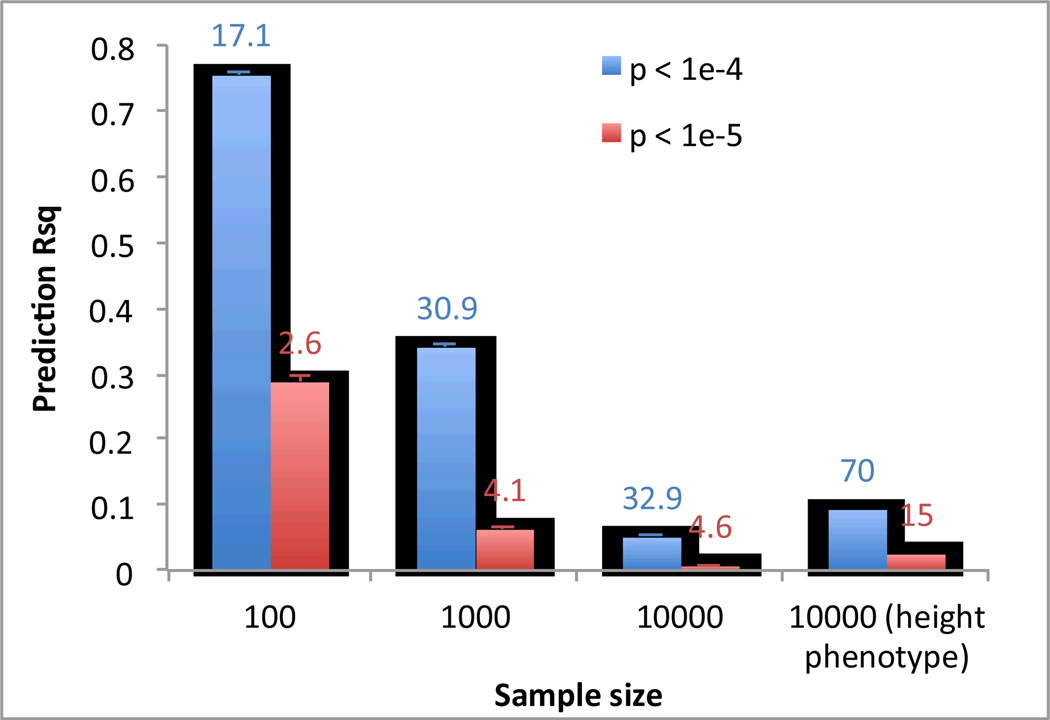
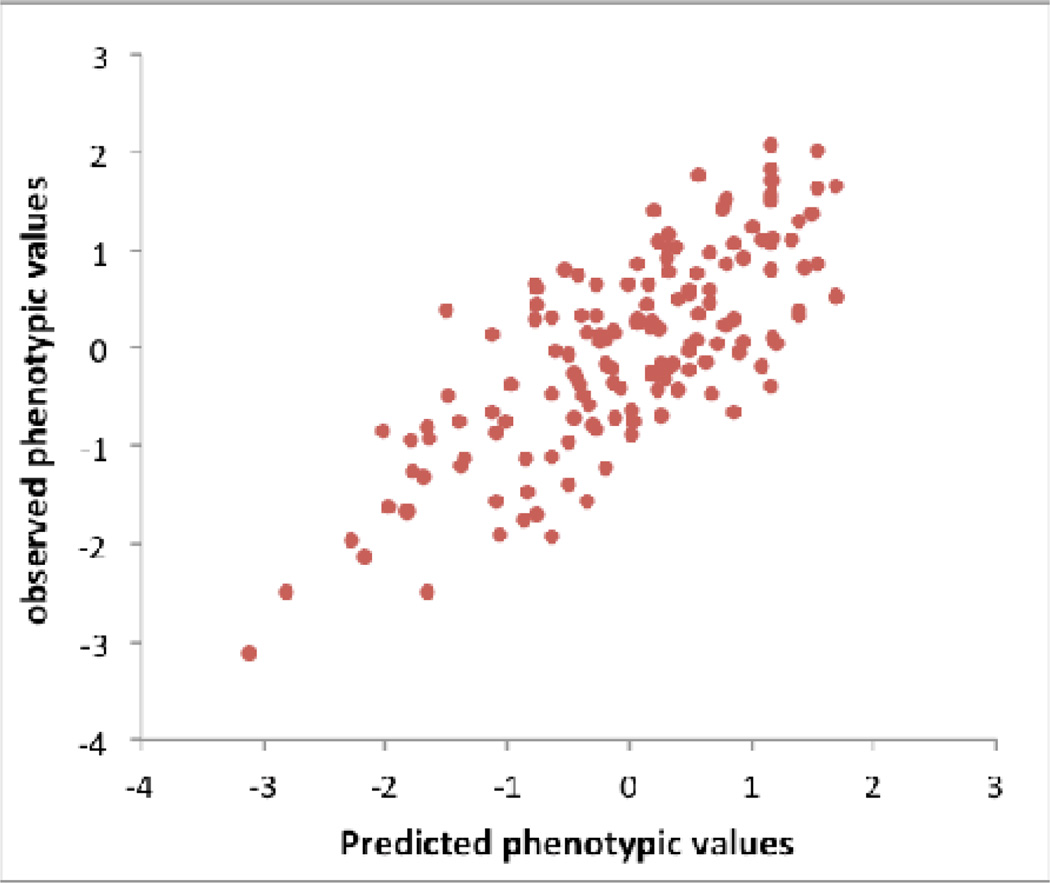
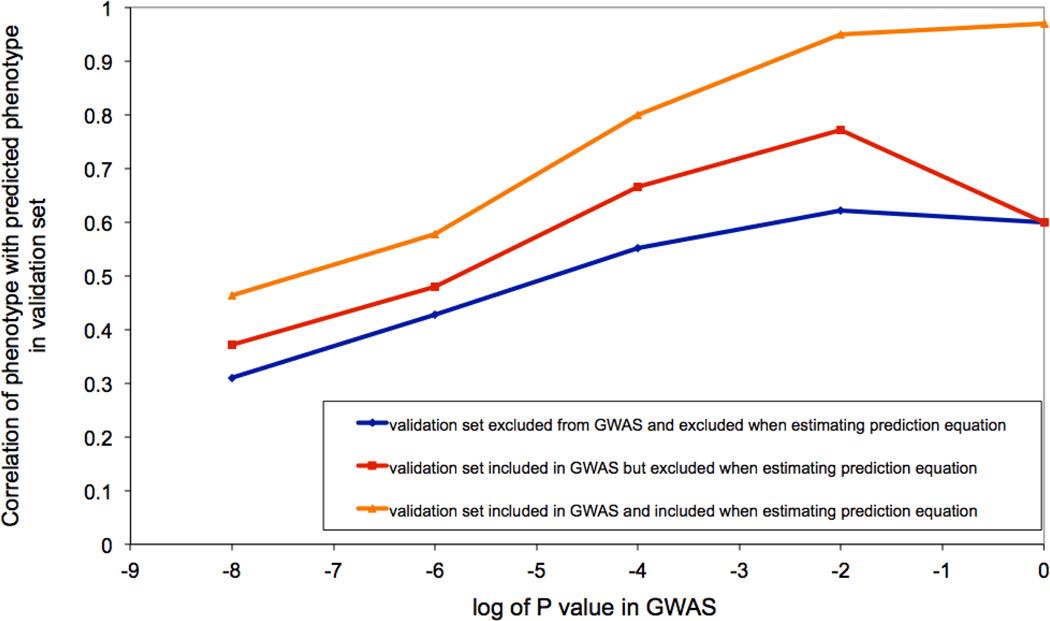
a) Human: High R2 can be achieved by chance particularly when sample size is small. We simulated GWAS data based upon real human genotype data under the null hypothesis of no association. We used data of 11,586 unrelated European Americans genotyped on 563,212 SNPs –. We randomly sampled N individuals and selected top SNPs for height at p < 10−5 (red bar) and p < 10−4 (blue bar) to predict the phenotype in the same data. We also performed association analysis for real height phenotype in 10,000 individuals and selected top SNPs at p < 10−5 (green bar) and p < 10−4 (purple bar) to predict height phenotype in the same sample. The graph shows the mean prediction R2 over 100 simulation replicates. Error bar: standard error of the mean. The number on top of each column is the mean number of selected SNPs over 100 simulation replicates. b) Drosophila: An example, illustrating bias when selecting the top SNPs. We downloaded genotype data of the Drosophila Genetics Reference Panel and simulated phenotypes under the null hypothesis, i.e., random association between each of the > 1 million SNPs and phenotype. We repeated the GWAS analysis reported in, selecting the top 10 independently associated SNPs and predicted the phenotypes of the lines using these 10 SNPs. Since in the simulated data there are only random associations between SNP and phenotype any prediction power is false and result of over-fitting. By chance, the top SNPs (in terms of test statistic) explain 57% (R2=57%) of the phenotypic variance between the inbred lines, from a linear regression of phenotype on predictor. Both phenotype and predictor have been standardized to normal distribution z-scores (mean of zero and standard deviation of one). c) Dairy Cattle: The impact of leaving the validation cohort in the discovery set, either at both SNP selection (GWAS) and SNP effect estimation stages, or at the effect size estimation stage only. Data shown are from 2,732 bulls with ~500K SNPs phenotyped for average milk yield of their daughters’ milk production. The bulls were split into a discovery sample (bulls born during or before 2003), Nd = 2,458, and a validation sample (bulls born after 2003) of Nv= 274.
a) Human: High R2 can be achieved by chance particularly when sample size is small. We simulated GWAS data based upon real human genotype data under the null hypothesis of no association. We used data of 11,586 unrelated European Americans genotyped on 563,212 SNPs –. We randomly sampled N individuals and selected top SNPs for height at p < 10−5 (red bar) and p < 10−4 (blue bar) to predict the phenotype in the same data. We also performed association analysis for real height phenotype in 10,000 individuals and selected top SNPs at p < 10−5 (green bar) and p < 10−4 (purple bar) to predict height phenotype in the same sample. The graph shows the mean prediction R2 over 100 simulation replicates. Error bar: standard error of the mean. The number on top of each column is the mean number of selected SNPs over 100 simulation replicates. b) Drosophila: An example, illustrating bias when selecting the top SNPs. We downloaded genotype data of the Drosophila Genetics Reference Panel and simulated phenotypes under the null hypothesis, i.e., random association between each of the > 1 million SNPs and phenotype. We repeated the GWAS analysis reported in, selecting the top 10 independently associated SNPs and predicted the phenotypes of the lines using these 10 SNPs. Since in the simulated data there are only random associations between SNP and phenotype any prediction power is false and result of over-fitting. By chance, the top SNPs (in terms of test statistic) explain 57% (R2=57%) of the phenotypic variance between the inbred lines, from a linear regression of phenotype on predictor. Both phenotype and predictor have been standardized to normal distribution z-scores (mean of zero and standard deviation of one). c) Dairy Cattle: The impact of leaving the validation cohort in the discovery set, either at both SNP selection (GWAS) and SNP effect estimation stages, or at the effect size estimation stage only. Data shown are from 2,732 bulls with ~500K SNPs phenotyped for average milk yield of their daughters’ milk production. The bulls were split into a discovery sample (bulls born during or before 2003), Nd = 2,458, and a validation sample (bulls born after 2003) of Nv= 274.
a) Human: High R2 can be achieved by chance particularly when sample size is small. We simulated GWAS data based upon real human genotype data under the null hypothesis of no association. We used data of 11,586 unrelated European Americans genotyped on 563,212 SNPs –. We randomly sampled N individuals and selected top SNPs for height at p < 10−5 (red bar) and p < 10−4 (blue bar) to predict the phenotype in the same data. We also performed association analysis for real height phenotype in 10,000 individuals and selected top SNPs at p < 10−5 (green bar) and p < 10−4 (purple bar) to predict height phenotype in the same sample. The graph shows the mean prediction R2 over 100 simulation replicates. Error bar: standard error of the mean. The number on top of each column is the mean number of selected SNPs over 100 simulation replicates. b) Drosophila: An example, illustrating bias when selecting the top SNPs. We downloaded genotype data of the Drosophila Genetics Reference Panel and simulated phenotypes under the null hypothesis, i.e., random association between each of the > 1 million SNPs and phenotype. We repeated the GWAS analysis reported in, selecting the top 10 independently associated SNPs and predicted the phenotypes of the lines using these 10 SNPs. Since in the simulated data there are only random associations between SNP and phenotype any prediction power is false and result of over-fitting. By chance, the top SNPs (in terms of test statistic) explain 57% (R2=57%) of the phenotypic variance between the inbred lines, from a linear regression of phenotype on predictor. Both phenotype and predictor have been standardized to normal distribution z-scores (mean of zero and standard deviation of one). c) Dairy Cattle: The impact of leaving the validation cohort in the discovery set, either at both SNP selection (GWAS) and SNP effect estimation stages, or at the effect size estimation stage only. Data shown are from 2,732 bulls with ~500K SNPs phenotyped for average milk yield of their daughters’ milk production. The bulls were split into a discovery sample (bulls born during or before 2003), Nd = 2,458, and a validation sample (bulls born after 2003) of Nv= 274.
Comment in
-
A commentary on Pitfalls of predicting complex traits from SNPs.Nat Rev Genet. 2013 Dec;14(12):894. doi: 10.1038/nrg3457-c1. Nat Rev Genet. 2013. PMID: 24240514 Free PMC article. No abstract available.
-
Author reply to A commentary on Pitfalls of predicting complex traits from SNPs.Nat Rev Genet. 2013 Dec;14(12):894. doi: 10.1038/nrg3457-c2. Nat Rev Genet. 2013. PMID: 24240515 Free PMC article. No abstract available.
References
-
- de los Campos G, Gianola D, Allison DB. Predicting genetic predisposition in humans: the promise of whole-genome markers. Nat Rev Genet. 2010;11:880–886. - PubMed
Publication types
MeSH terms
Substances
Grants and funding
- HHSN268201100012C/HL/NHLBI NIH HHS/United States
- HHSN268201100009I/HL/NHLBI NIH HHS/United States
- R01 DK058845/DK/NIDDK NIH HHS/United States
- U01 HG004446/HG/NHGRI NIH HHS/United States
- HHSN268201100010C/HL/NHLBI NIH HHS/United States
- R01 HL059367/HL/NHLBI NIH HHS/United States
- HHSN268201100006C/HL/NHLBI NIH HHS/United States
- N01 HC025195/HL/NHLBI NIH HHS/United States
- HHSN268201100005I/HL/NHLBI NIH HHS/United States
- R01 GM075091/GM/NIGMS NIH HHS/United States
- HHSN268201100007I/HL/NHLBI NIH HHS/United States
- R01 MH100141/MH/NIMH NIH HHS/United States
- R01 HL087641/HL/NHLBI NIH HHS/United States
- U01 HG004399/HG/NHGRI NIH HHS/United States
- UL1 RR025005/RR/NCRR NIH HHS/United States
- P01 CA087969/CA/NCI NIH HHS/United States
- HHSN268201100008C/HL/NHLBI NIH HHS/United States
- N02 HL064278/HL/NHLBI NIH HHS/United States
- HHSN268201100005G/HL/NHLBI NIH HHS/United States
- HHSN268201100008I/HL/NHLBI NIH HHS/United States
- HHSN268201100007C/HL/NHLBI NIH HHS/United States
- P01 CA055075/CA/NCI NIH HHS/United States
- P01 GM099568/GM/NIGMS NIH HHS/United States
- N01 HC025195/HC/NHLBI NIH HHS/United States
- HHSN268201100011I/HL/NHLBI NIH HHS/United States
- HHSN268201100011C/HL/NHLBI NIH HHS/United States
- R01 HL086694/HL/NHLBI NIH HHS/United States
- R01 HG006399/HG/NHGRI NIH HHS/United States
- U01 HG004402/HG/NHGRI NIH HHS/United States
- U01 HG004424/HG/NHGRI NIH HHS/United States
- HHSN268201100009C/HL/NHLBI NIH HHS/United States
- HHSN268201100005C/HL/NHLBI NIH HHS/United States
LinkOut - more resources
Full Text Sources
Other Literature Sources
