. 2013 Jun 18:9:674.
doi: 10.1038/msb.2013.30.

Dissecting a complex chemical stress: chemogenomic profiling of plant hydrolysates

Affiliations

Dissecting a complex chemical stress: chemogenomic profiling of plant hydrolysates

Jeffrey M Skerker et al. Mol Syst Biol. .

Abstract

The efficient production of biofuels from cellulosic feedstocks will require the efficient fermentation of the sugars in hydrolyzed plant material. Unfortunately, plant hydrolysates also contain many compounds that inhibit microbial growth and fermentation. We used DNA-barcoded mutant libraries to identify genes that are important for hydrolysate tolerance in both Zymomonas mobilis (44 genes) and Saccharomyces cerevisiae (99 genes). Overexpression of a Z. mobilis tolerance gene of unknown function (ZMO1875) improved its specific ethanol productivity 2.4-fold in the presence of miscanthus hydrolysate. However, a mixture of 37 hydrolysate-derived inhibitors was not sufficient to explain the fitness profile of plant hydrolysate. To deconstruct the fitness profile of hydrolysate, we profiled the 37 inhibitors against a library of Z. mobilis mutants and we modeled fitness in hydrolysate as a mixture of fitness in its components. By examining outliers in this model, we identified methylglyoxal as a previously unknown component of hydrolysate. Our work provides a general strategy to dissect how microbes respond to a complex chemical stress and should enable further engineering of hydrolysate tolerance.


Conflict of interest statement

The authors declare that they have no conflict of interest.

Figures
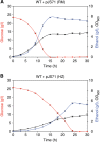
Figure 1
Figure 1
Miscanthus hydrolysate inhibits Z. mobilis growth and ethanol production. Batch fermentation profiles for wild-type Z. mobilis strain carrying an empty control plasmid (WT+pJS71) either in (A) rich media (RM) or in (B) rich media supplemented with 8% (v/v) batch 2 miscanthus hydrolysate (HZ). Data shown are the average of four replicates and error bars indicate standard deviation.
Figure 2
Figure 2
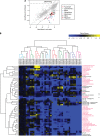
Genome-wide fitness profiling of Z. mobilis in 58 experimental conditions, including plant hydrolysate and 37 individual components of hydrolysate. Average gene fitness data are represented as a two-dimensional heat map for 1586 genes (X axis) and 58 experimental conditions (Y axis). For each transposon mutant in our pool, strain fitness is calculated as log2 ratio of (END/START). Gene fitness values are the average of per-strain fitness across all insertions within that gene and are displayed according to the color bar at the top right of the heat map. In addition, gene fitness values have also been averaged across replicate experimental conditions. Chemicals with similar structures cluster together on the Y axis (labeled 1–10) and differ by a single functional group, as colored by the key at the top left. For example, compounds 2,5-dihydroxybenzoic acid and 3-hydroxybenzoic acid (cluster 1) differ by a single hydroxyl group (see Supplementary Figure 8 for more examples). The fitness data were clustered in both dimensions by hierarchical agglomerative clustering with complete linkage. Euclidean distance was used as the distance metric for genes and Pearson’s correlation was used as the similarity metric for experimental conditions. Hydrolysate components are indicated by red text.
Figure 3
Figure 3
Identification of 44 Z. mobilis genes that are important for growth and 1 gene that is detrimental for growth in plant hydrolysate. (A) Scatter plot of gene fitness values in rich media (average of 24 experiments) versus gene fitness in hydrolysate (average of 37 experiments) for 1586 Z. mobilis genes. A dashed grey line indicates X=Y and dashed black lines indicate the cutoffs used to select tolerance genes. Putative tolerance genes have a more negative fitness value in hydrolysate than in rich media and are indicated by colored symbols. They are further classified based on their predicted function, as indicated in the legend. A single gene (ZMO1496), indicated by a black circle, was found to be detrimental for growth in plant hydrolysate. (B) Subset of average gene fitness data from Figure 2, showing only the fitness data for the 44 tolerance genes. The 37 hydrolysate components are indicated by red text. Arrows indicate the baseline condition without any added inhibitors (rich media), or rich media supplemented with DMSO (DMSO) or plant hydrolysate (hydrolysate). Gene fitness values are colored according to the color bar at the top right of the heat map. Each tolerance gene on the X axis is labeled by its systematic gene name (ZMOxxxx) and the clustering is colored based on predicted functional classes, as in (A). Tolerance genes were clustered by Euclidean distance, and conditions were clustered as in Figure 2.
Figure 4
Figure 4
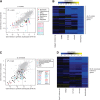
Synthetic hydrolysate mixtures do not fully explain the fitness profile of real hydrolysate. Two synthetic hydrolysate mixtures containing either 37 components (SYN-37) or the 10 most abundant components (SYN-10) were made based on the composition of miscanthus batch 1 (Supplementary Table 1). Data for SYN-10 are shown in Supplementary Figure 12. (A) Scatterplot of Z. mobilis gene fitness data in SYN-37 (average of 4 experiments) versus in hydrolysate (average of 37 experiments). The 44 Z. mobilis tolerance genes are color coded by category. Nine outlier genes (defined by two dashed black lines) have more negative gene fitness values in hydrolysate than in SYN-37, and are listed in a black box and color coded by category. (B) Heatmap of gene fitness data for the 44 Z. mobilis tolerance genes. Genes were clustered by Euclidean distance with complete linkage using all non-averaged fitness data. Fitness values are colored according to the color bar. The baseline conditions are rich media (ZRMG) and rich media supplemented with DMSO (DMSO). (C) Scatterplot of S. cerevisiae gene fitness data in SYN-37 (average of 6 experiments) versus in batch 1 miscanthus hydrolysate (average of 6 experiments). In all, 99 putative tolerance genes are color coded according to their function as indicated on the graph legend. Twenty of these genes are outliers (defined by two dashed black lines) and have more negative fitness values in hydrolysate than in SYN-37. Outlier genes are listed in a black box and color coded according to the legend. (D) Heatmap of gene fitness data for the 99 S. cerevisiae tolerance genes. Genes were clustered as in (B). Fitness values are colored according to the color bar. Two baseline conditions are shown: YPD is the rich media used for S. cerevisiae growth (n=3) and ZRMG is the rich media used for Z. mobilis growth that was also used to prepare the SYN-10 and SYN-37 synthetic hydrolysate mixtures (n=2, see Materials and methods).
Figure 5
Figure 5
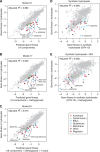
Linear model of hydrolysate fitness based on fitness profiles of chemical components and identification of a new component, methylglyoxal. (A) Scatterplot of actual and predicted gene fitness in Z. mobilis. The model is a linear combination of fitness in rich media and in 16 inhibitors (Model-16). Arrows indicate three outlier genes, ZMO0759, ZMO0760, and ZMO0846. Four additional outlier genes, ZMO1429-ZMO1432, are enclosed by an ellipse. (B) Scatterplot of actual and predicted gene fitness in hydrolysate using a 17-component model that includes methylglyoxal fitness data (Model-17). (C) Scatterplot of actual and predicted gene fitness in hydrolysate using a 24-component model that includes methylglyoxal (MG) and 7 additional significant conditions (Model-24). (D) Plot of average gene fitness (n=4) for a10-component synthetic hydrolysate mixture (SYN-10) versus average gene fitness in hydrolysate (n=37). Arrows indicate two outlier genes, ZMO0759 and ZMO0760, which encode the GloAB detoxification system. Mutants in these genes are sensitive to hydrolysate but not to SYN-10. (E) In SYN-10 with methylglyoxal added (n=2), ZMO0759 and ZMO0760 are now important for fitness, which suggests that methylglyoxal stress contributes to hydrolysate toxicity. In all panels, the 44 Z. mobilis tolerance genes are color coded according to their function as indicated on the graph legend.
Figure 6
Figure 6
Overexpression of ZMO1875 improves ethanol productivity in the presence of miscanthus hydrolysate. Batch fermentation profile of the Z. mobilis wild-type+Pbad-ZMO1875 overexpression strain grown in rich media supplemented with 8% (v/v) batch 2 miscanthus hydrolysate (HZ). A control fermentation (WT+pJS71, colored symbols over dotted grey lines) is also shown for comparison (data taken from Figure 1B). Data shown are the average of four replicates and error bars indicate standard deviation.

Similar articles

Cited by

References

    1. Agrawal M, Wang Y, Chen RR (2012) Engineering efficient xylose metabolism into an acetic acid-tolerant Zymomonas mobilis strain by introducing adaptation-induced mutations. Biotechnol Lett 34: 1825–1832 - PubMed
    1. Alic N, Higgins VJ, Dawes IW (2001) Identification of a Saccharomyces cerevisiae gene that is required for G1 arrest in response to the lipid oxidation product linoleic acid hydroperoxide. Mol Biol Cell 12: 1801–1810 - PMC - PubMed
    1. Allen SA, Clark W, McCaffery JM, Cai Z, Lanctot A, Slininger PJ, Liu ZL, Gorsich SW (2010) Furfural induces reactive oxygen species accumulation and cellular damage in Saccharomyces cerevisiae. Biotechnol Biofuels 3: 2. - PMC - PubMed
    1. Almeida JR, Modig T, Petersson A, Hahn-Hagerdal B, Lidén G, Gorwa-Grauslund M-F (2007) Increased tolerance and conversion of inhibitors in lignocellulosic hydrolysates by Saccharomyces cerevisiae. J Chem Technol Biotechnol 82: 340–349
    1. Amin G, Van den Eynde E, Verachtert H (1983) Determination of by-products formed during the ethanolic fermentation, using batch and immobilized cell systems of Zymomonas mobilis and Saccharomyces bayanus. Eur J Appl Microbiol Biotechnol 18: 1–5

Publication types

MeSH terms