. 2013 Jun 18:9:675.
doi: 10.1038/msb.2013.32.

Efficient translation initiation dictates codon usage at gene start

Affiliations

Efficient translation initiation dictates codon usage at gene start

Kajetan Bentele et al. Mol Syst Biol. .

Abstract

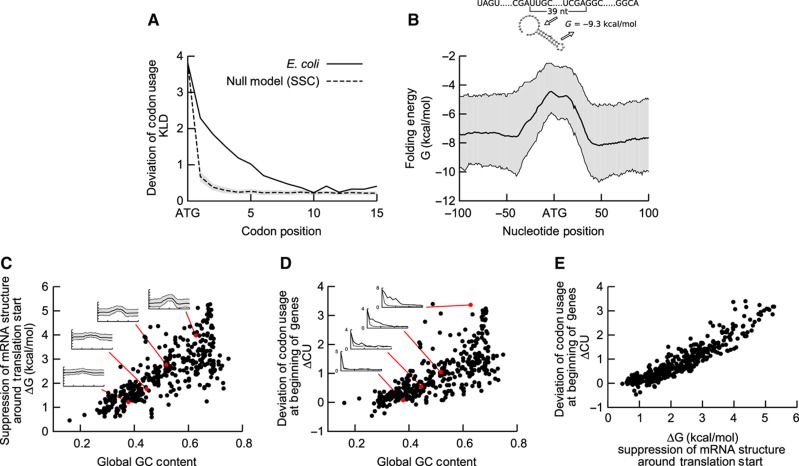
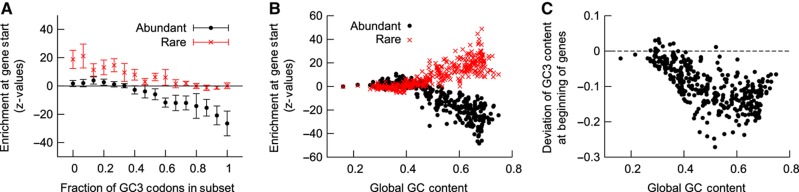
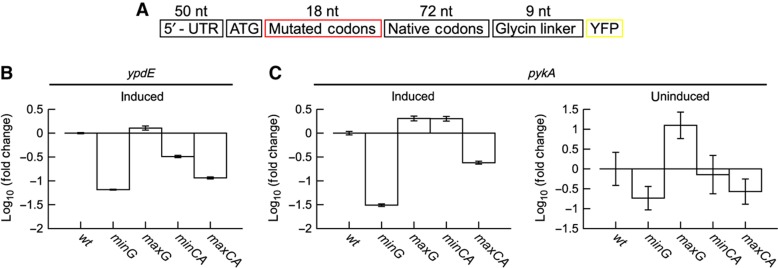
The genetic code is degenerate; thus, protein evolution does not uniquely determine the coding sequence. One of the puzzles in evolutionary genetics is therefore to uncover evolutionary driving forces that result in specific codon choice. In many bacteria, the first 5-10 codons of protein-coding genes are often codons that are less frequently used in the rest of the genome, an effect that has been argued to arise from selection for slowed early elongation to reduce ribosome traffic jams. However, genome analysis across many species has demonstrated that the region shows reduced mRNA folding consistent with pressure for efficient translation initiation. This raises the possibility that unusual codon usage is a side effect of selection for reduced mRNA structure. Here we discriminate between these two competing hypotheses, and show that in bacteria selection favours codons that reduce mRNA folding around the translation start, regardless of whether these codons are frequent or rare. Experiments confirm that primarily mRNA structure, and not codon usage, at the beginning of genes determines the translation rate.


Conflict of interest statement

The authors declare that they have no conflict of interest.

Figures

Figure 1
Figure 1
Unusual codon usage and suppression of mRNA structure at the gene start in bacteria. (A) In E. coli, the frequency of synonymous codons within the first eight codons after translation start deviates from the global codon usage in the genome, as quantified by the KLD (solid line). A null model with SSC (dashed line) shows that the bias due to finite size sampling is significantly lower. (B) Folding energy of E. coli mRNA sequences calculated within a sliding window of 39 nts shows a maximum at translation start site, indicating the suppression of mRNA secondary structure around the start codon. Average folding energy is shown as a solid line, surrounded by the interquartile range in grey. (C) Suppression of mRNA structure around the start codon is largely determined by the global GC content. Insets from bottom to top correspond to KLD profiles calculated for the genomes of Thermoanaerobacter tengcongensis, Bacillus subtilis, E. coli and Aeromonas hydrophila, respectively. (D) Average deviation of codon usage (ΔCU) of the first five codons correlates with the GC content of the organism. The insets are ordered as in C. (E) Deviation from the global codon usage (ΔCU) and suppression of mRNA structure (ΔG) around the start codon are strongly correlated (414 bacterial genomes, correlation coefficient r=0.93).
Figure 2
Figure 2
GC content at the beginning of genes in E. coli. (A) GC content (dashed line) and GC3 content (solid line) of codons decrease at the beginning of genes inE. coli. Dotted line and grey area shows mean GC3 content±s.d., estimated from the null model (SSC). (B) GC1 and GC2 content are decreased at gene start (solid lines) when compared with a null model with SC. This is primarily due to the choice of amino acids, as the GC2 content is fully determined by the amino acid, and the null model with SSC (dotted line) shows only a small deviation for the GC1 content.
Figure 3
Figure 3
Rare and abundant codons. (A) Rare and abundant codons were defined for each genome as the 15 most rare and abundant codons, respectively. The overall frequency for both of these subsets are shown as a box plots for 414 genomes, with median total frequency of ∼0.06 and ∼0.53 for rare and abundant codons, respectively. (B) The ratio of total frequencies of abundant and rare codons is shown as a function of global GC content. Genomes with more extreme GC content show stronger bias in codon usage. (C, D) The normed frequency distribution of rare and abundant codons for different genomes is shown with their GC content indicated by different grey levels. GC content of the genomes increases from left to right. GC-rich organisms tend to have more AU-rich rare codons (C) and GC-rich abundant codons (D), with an inverse relation for AU-rich genomes. Note that E. coli with a GC content of about 0.5 is rather balanced. (E) Average±s.d. of global GC content are shown for organisms grouped according to the number of GC3 codons in the sets for rare and abundant codons. Higher global GC content implies increase of GC3 content for abundant codons and increase of AU3 content for rare codons.
Figure 4
Figure 4
Frequency of extreme codons at beginning of genes in E. coli. Rare codons (A) are enriched and abundant codons (B) are depleted at the beginning of genes in E. coli as shown by the change of total codon frequencies in the left panels. (A) Only rare codons with AU3 (right panel, solid line) are enriched at gene start, whereas rare GC3 codons (right panel, dashed line) are not enriched. (B) Frequency of abundant GC3 codons (right panel, dashed line) is strongly reduced, whereas abundant AU3 codons (right panel, solid line) are even more frequent at gene start. Greyed areas show the corresponding average total frequency±s.d. estimated from the null model SSC.
Figure 5
Figure 5
Enrichment of extreme codons and deviation of GC3 content in bacterial genomes. (A, B) Enrichment of codons was assessed by calculating Z-values of fold change for codon frequency at the beginning of genes for rare (red crosses) and abundant (black dots) codons compared with the null model (SSC). (A) Genomes were grouped according to the fraction of GC3 codons in the subset of rare and abundant codons, and mean enrichment±s.d. is shown for these groups. Genomes with GC3-rich abundant codons show a depletion of abundant codons, and genomes with AU3-rich rare codons show an enrichment of rare codons at gene start. (B) Enrichment of extreme codons shown as a function of GC content. Rare codons are only enriched and abundant codons depleted in genomes with GC content larger than about 0.5. (C) The average deviation from the genomic GC3 content for codons 1–5 depends on the global GC content. Virtually all genomes show a reduction in GC3 content at the gene start, and genomes with higher genomic GC content typically show a stronger reduction (correlation coefficient r=−0.66).
Figure 6
Figure 6
Influence of synonymous mutations on gene expression. (A) Constructs encoding for the same amino acid sequence, but varying codon usage and folding energy were derived from two different E. coli genes and fused to yellow fluorescent protein (YFP) gene. (B, C) All constructs were expressed in E. coli in triplicates and the fluorescence was measured after induction by flow cytometry. The median of fluorescence distributions was averaged and normalized to wild-type expression. Errors based on the s.d. of the median were calculated by propagating uncertainties. Constructs with varying folding energy but similar codon usage had a pronounced and reproducible effect on translation efficiency. Sequences with strong secondary structure (minG) had weaker expression than wild-type (wt), and constructs with loose structure (maxG) showed higher expression. Effects on gene expression by modifying codon usage, i.e., maximal and minimal adapted, but not changing folding energy, were present but less pronounced and inconsistent (compare minCA and maxCA for usage of codons corresponding to rare and abundant tRNAs, respectively). Moreover, effects of altering codon usage were less pronounced for pykA without gene induction.

References

    1. Beyer D, Skripkin E, Wadzack J, Nierhaus KH (1994) How the ribosome moves along the mRNA during protein synthesis. J Biol Chem 269: 30713–30717 - PubMed
    1. Cannarozzi G, Cannarrozzi G, Schraudolph NN, Faty M, von Rohr P, Friberg MT, Roth AC, Gonnet P, Gonnet G, Barral Y (2010) A role for codon order in translation dynamics. Cell 141: 355–367 - PubMed
    1. Chu D, Barnes DJ, von der Haar T (2011) The role of tRNA and ribosome competition in coupling the expression of different mRNAs in Saccharomyces cerevisiae. Nucleic Acids Res 39: 6705–6714 - PMC - PubMed
    1. Chu D, von der Haar T (2012) The architecture of eukaryotic translation. Nucleic Acids Res 40: 10098–10106 - PMC - PubMed
    1. de Smit MH, van Duin J (1990) Secondary structure of the ribosome binding site determines translational efficiency: a quantitative analysis. Proc Natl Acad Sci USA 87: 7668–7672 - PMC - PubMed

Publication types

LinkOut - more resources