

Integrative genomics of gene and metabolic regulation by estrogen receptors α and β, and their coregulators
- PMID: 23774759
- PMCID: PMC3964312
- DOI: 10.1038/msb.2013.28
Integrative genomics of gene and metabolic regulation by estrogen receptors α and β, and their coregulators
Erratum in
-
Integrative genomics of gene and metabolic regulation by estrogen receptors α and β, and their coregulators.Mol Syst Biol. 2017 Apr 25;13(4):929. doi: 10.15252/msb.20177595. Mol Syst Biol. 2017. PMID: 28442489 Free PMC article.
Abstract
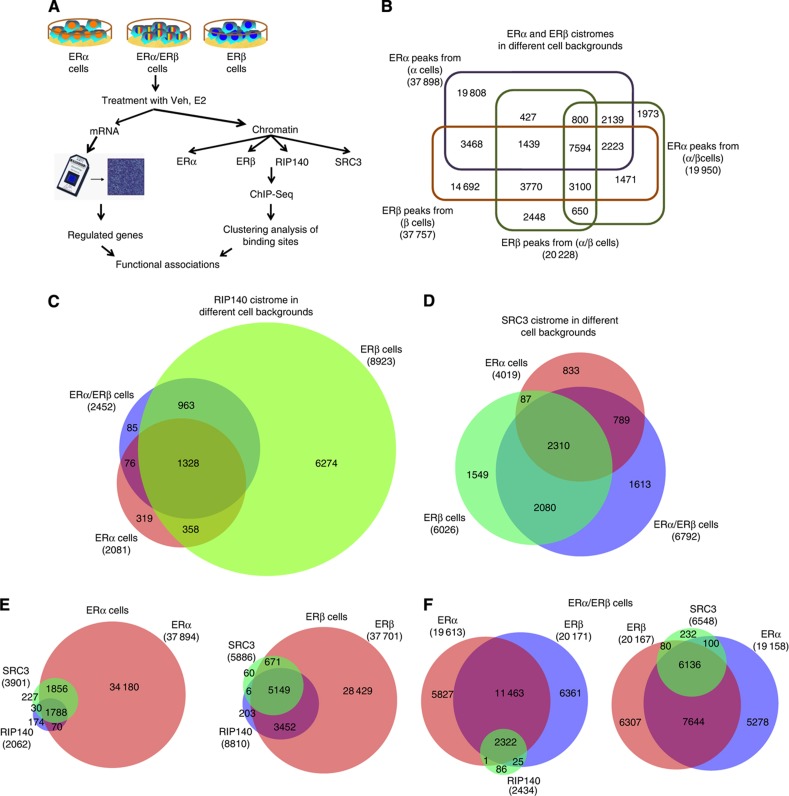
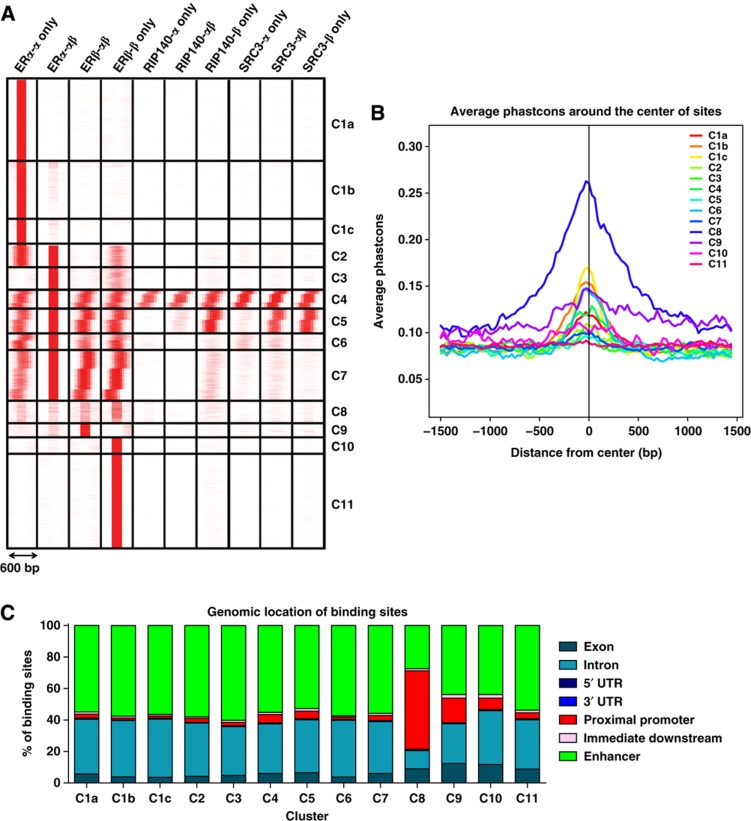
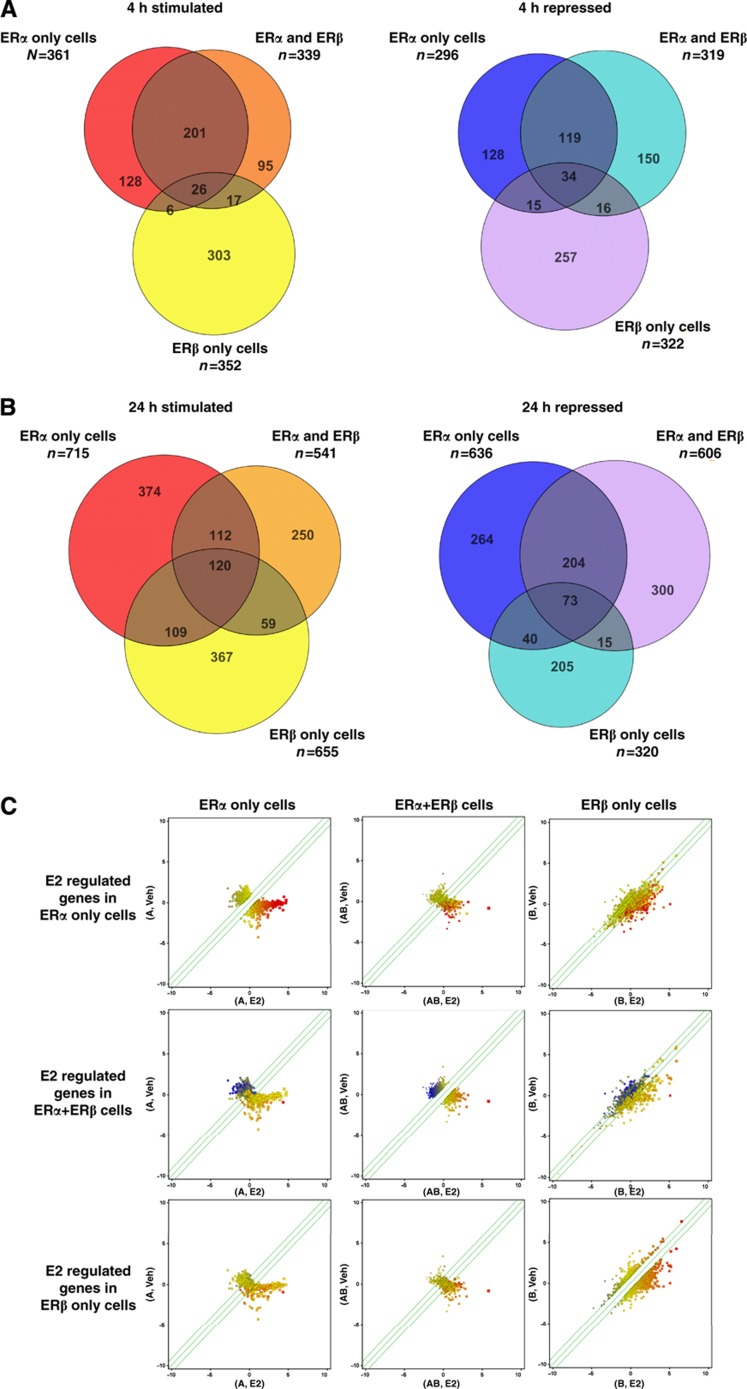
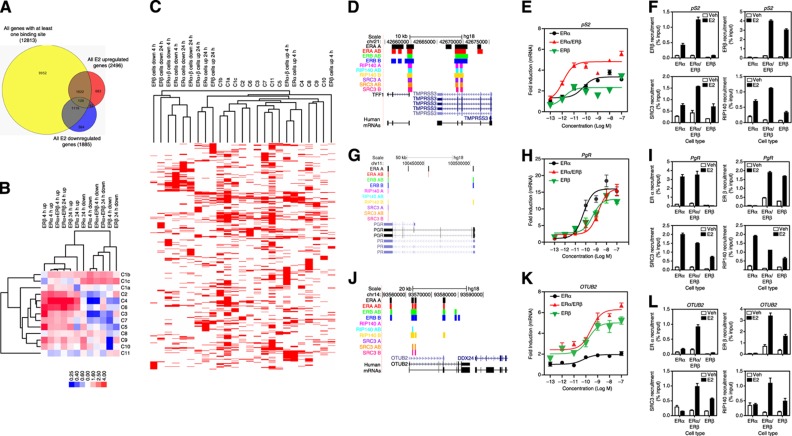
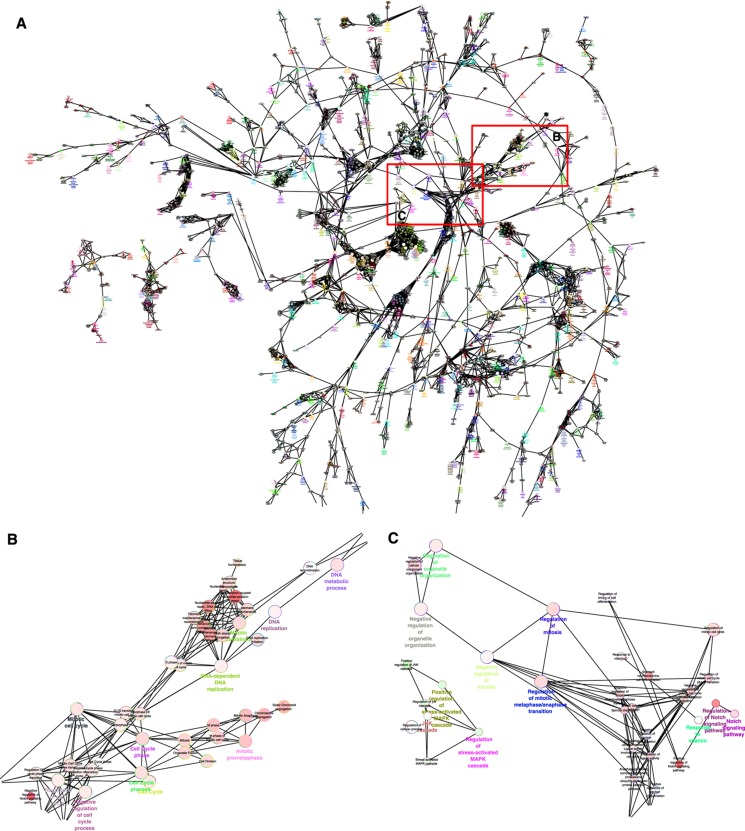
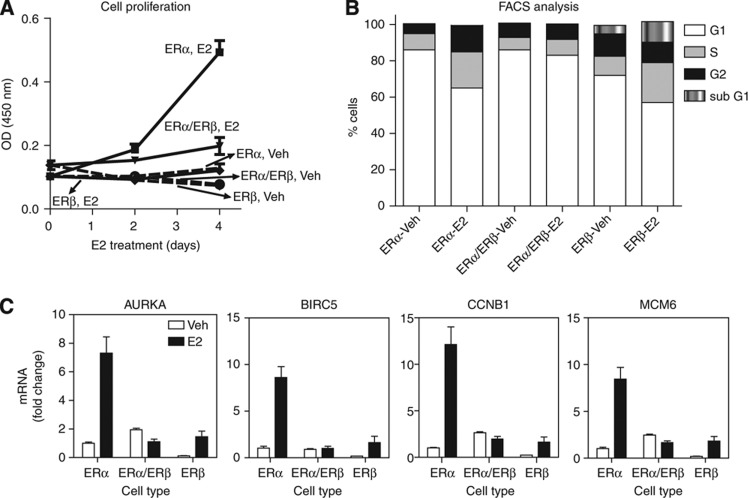
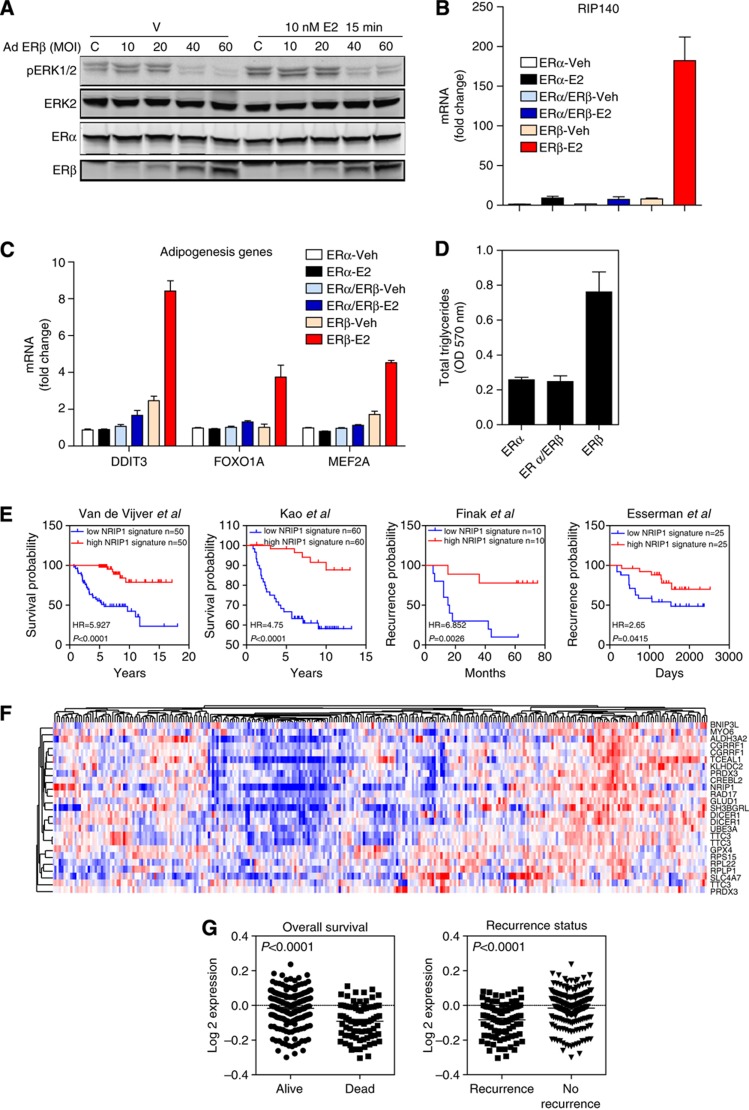
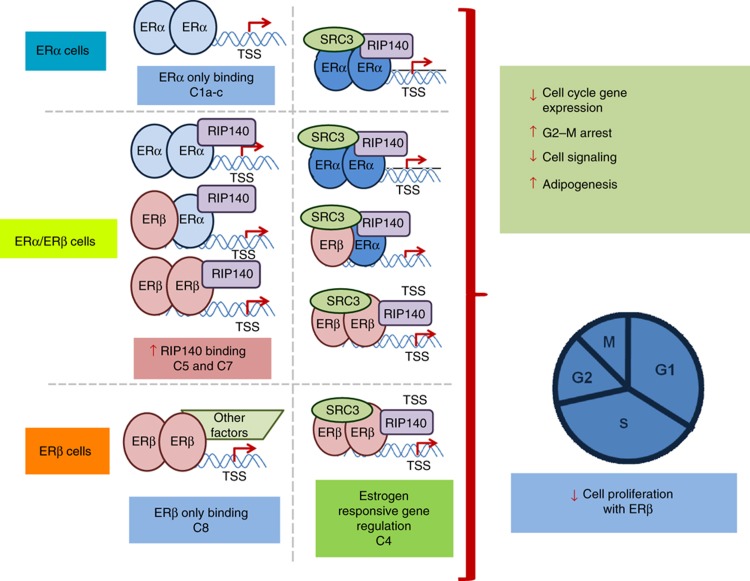
The closely related transcription factors (TFs), estrogen receptors ERα and ERβ, regulate divergent gene expression programs and proliferative outcomes in breast cancer. Utilizing breast cancer cells with ERα, ERβ, or both receptors as a model system to define the basis for differing response specification by related TFs, we show that these TFs and their key coregulators, SRC3 and RIP140, generate overlapping as well as unique chromatin-binding and transcription-regulating modules. Cistrome and transcriptome analyses and the use of clustering algorithms delineated 11 clusters representing different chromatin-bound receptor and coregulator assemblies that could be functionally associated through enrichment analysis with distinct patterns of gene regulation and preferential coregulator usage, RIP140 with ERβ and SRC3 with ERα. The receptors modified each other's transcriptional effect, and ERβ countered the proliferative drive of ERα through several novel mechanisms associated with specific binding-site clusters. Our findings delineate distinct TF-coregulator assemblies that function as control nodes, specifying precise patterns of gene regulation, proliferation, and metabolism, as exemplified by two of the most important nuclear hormone receptors in human breast cancer.
Conflict of interest statement
The authors declare that they have no conflict of interest.
Figures
Similar articles
-
Aryl hydrocarbon receptor modulation of estrogen receptor α-mediated gene regulation by a multimeric chromatin complex involving the two receptors and the coregulator RIP140.Toxicol Sci. 2012 Feb;125(2):401-11. doi: 10.1093/toxsci/kfr300. Epub 2011 Nov 9. Toxicol Sci. 2012. PMID: 22071320 Free PMC article.
-
Mechanisms enforcing the estrogen receptor β selectivity of botanical estrogens.FASEB J. 2013 Nov;27(11):4406-18. doi: 10.1096/fj.13-234617. Epub 2013 Jul 23. FASEB J. 2013. PMID: 23882126 Free PMC article.
-
Negative regulation of estrogen signaling by ERβ and RIP140 in ovarian cancer cells.Mol Endocrinol. 2013 Sep;27(9):1429-41. doi: 10.1210/me.2012-1351. Epub 2013 Jul 24. Mol Endocrinol. 2013. PMID: 23885094 Free PMC article.
-
Estrogen receptors and extracellular matrix: the critical interplay in cancer development and progression.FEBS J. 2025 Apr;292(7):1558-1572. doi: 10.1111/febs.17270. Epub 2024 Sep 16. FEBS J. 2025. PMID: 39285617 Free PMC article. Review.
-
Estrogen receptor alpha negative breast cancer patients: estrogen receptor beta as a therapeutic target.J Steroid Biochem Mol Biol. 2008 Mar;109(1-2):1-10. doi: 10.1016/j.jsbmb.2007.12.010. Epub 2007 Dec 8. J Steroid Biochem Mol Biol. 2008. PMID: 18243688 Review.
Cited by
-
Systems Toxicology of Male Reproductive Development: Profiling 774 Chemicals for Molecular Targets and Adverse Outcomes.Environ Health Perspect. 2016 Jul;124(7):1050-61. doi: 10.1289/ehp.1510385. Epub 2015 Dec 11. Environ Health Perspect. 2016. PMID: 26662846 Free PMC article.
-
Estrogen Signaling Dictates Musculoskeletal Stem Cell Behavior: Sex Differences in Tissue Repair.Tissue Eng Part B Rev. 2022 Aug;28(4):789-812. doi: 10.1089/ten.TEB.2021.0094. Epub 2022 Jan 6. Tissue Eng Part B Rev. 2022. PMID: 34409868 Free PMC article. Review.
-
Licorice root components in dietary supplements are selective estrogen receptor modulators with a spectrum of estrogenic and anti-estrogenic activities.Steroids. 2016 Jan;105:42-9. doi: 10.1016/j.steroids.2015.11.006. Epub 2015 Nov 26. Steroids. 2016. PMID: 26631549 Free PMC article.
-
Estrogen Receptors Promote Migration, Invasion and Colony Formation of the Androgen-Independent Prostate Cancer Cells PC-3 Through β-Catenin Pathway.Front Endocrinol (Lausanne). 2020 Apr 9;11:184. doi: 10.3389/fendo.2020.00184. eCollection 2020. Front Endocrinol (Lausanne). 2020. PMID: 32328032 Free PMC article.
-
Unconventional Estrogen Signaling in Health and Disease.Endocrinology. 2020 Apr 1;161(4):bqaa030. doi: 10.1210/endocr/bqaa030. Endocrinology. 2020. PMID: 32128594 Free PMC article. Review.
References
-
- Ali S, Coombes RC (2000) Estrogen receptor alpha in human breast cancer: occurrence and significance. J Mammary Gland Biol Neoplasia 5: 271–281 - PubMed
-
- Anzick SL, Kononen J, Walker RL, Azorsa DO, Tanner MM, Guan XY, Sauter G, Kallioniemi OP, Trent JM, Meltzer PS (1997) AIB1, a steroid receptor coactivator amplified in breast and ovarian cancer. Science 277: 965–968 - PubMed
-
- Augereau P, Badia E, Fuentes M, Rabenoelina F, Corniou M, Derocq D, Balaguer P, Cavailles V (2006) Transcriptional regulation of the human NRIP1/RIP140 gene by estrogen is modulated by dioxin signalling. Mol Pharmacol 69: 1338–1346 - PubMed
-
- Azorsa DO, Cunliffe HE, Meltzer PS (2001) Association of steroid receptor coactivator AIB1 with estrogen receptor-alpha in breast cancer cells. Breast Cancer Res Treat 70: 89–101 - PubMed
-
- Barnett DH, Sheng S, Charn TH, Waheed A, Sly WS, Lin CY, Liu ET, Katzenellenbogen BS (2008) Estrogen receptor regulation of carbonic anhydrase XII through a distal enhancer in breast cancer. Cancer Res 68: 3505–3515 - PubMed
Publication types
MeSH terms
Substances
Grants and funding
LinkOut - more resources
Full Text Sources
Other Literature Sources
Medical
Molecular Biology Databases
Research Materials
Miscellaneous
