. 2013 Aug 9;288(32):23529-42.
doi: 10.1074/jbc.M113.484659. Epub 2013 Jun 17.

A reaction center-dependent photoprotection mechanism in a highly robust photosystem II from an extremophilic red alga, Cyanidioschyzon merolae

Affiliations

A reaction center-dependent photoprotection mechanism in a highly robust photosystem II from an extremophilic red alga, Cyanidioschyzon merolae

Tomasz Krupnik et al. J Biol Chem. .

Abstract

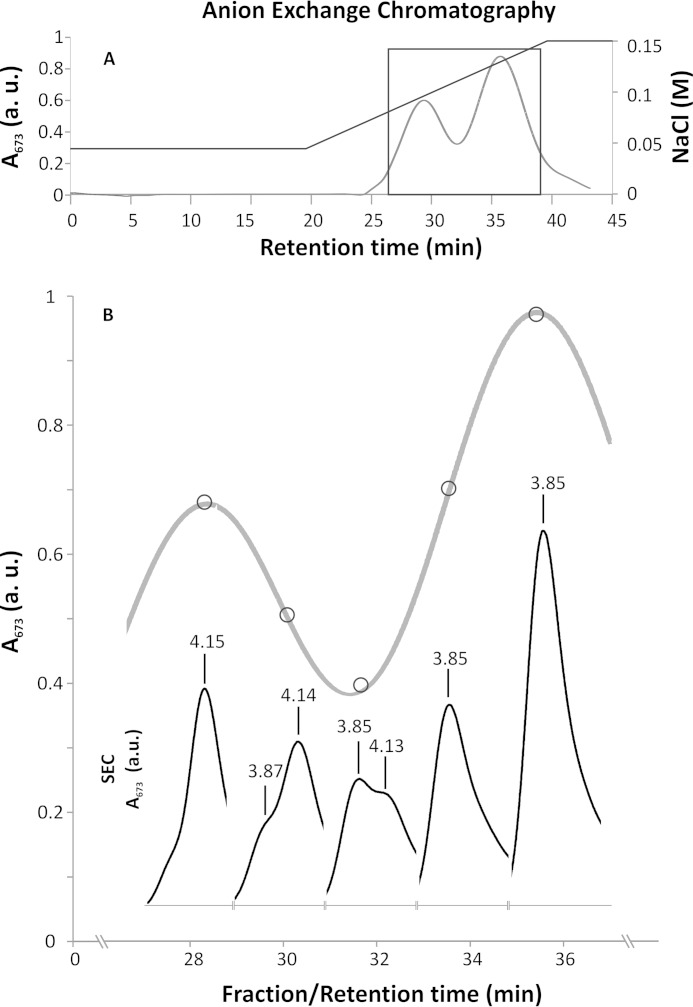
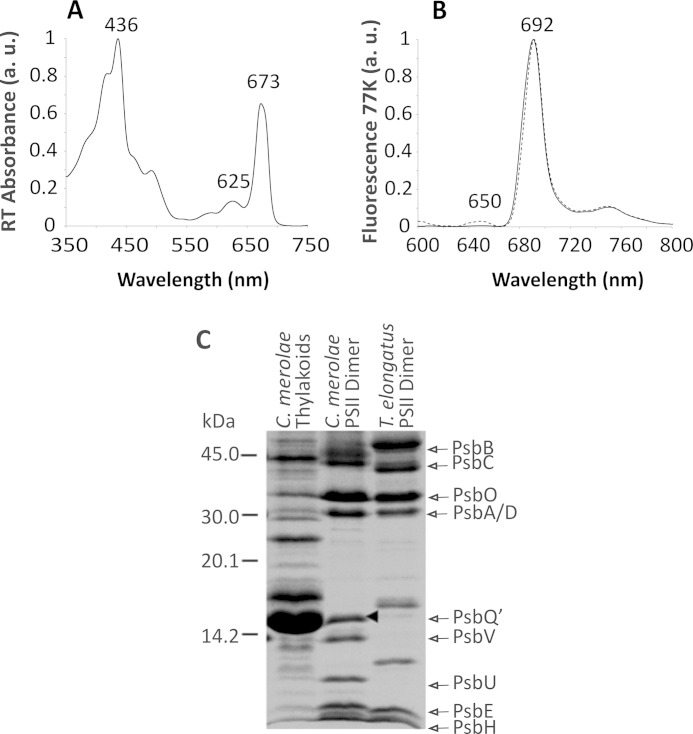
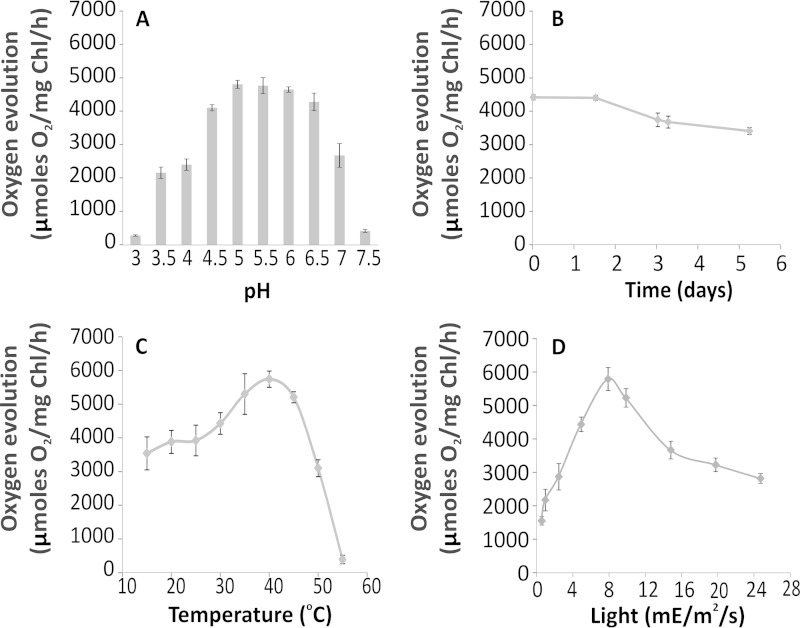
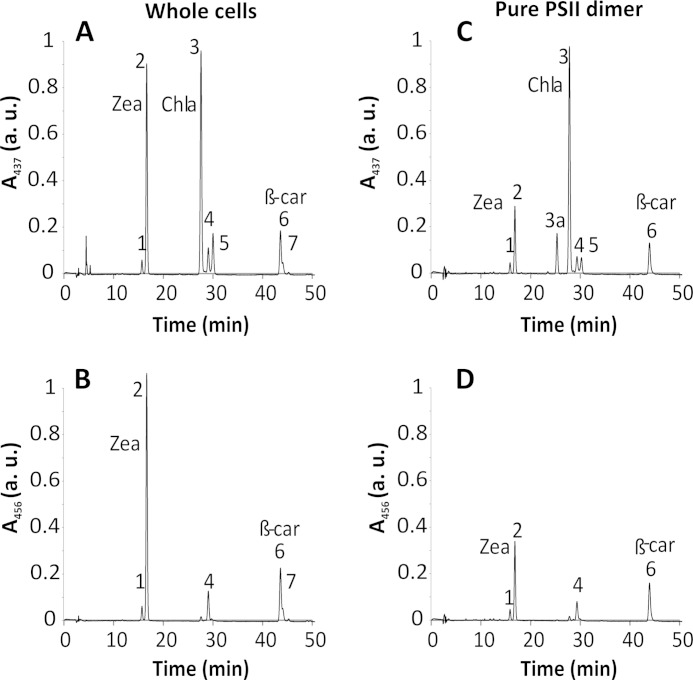
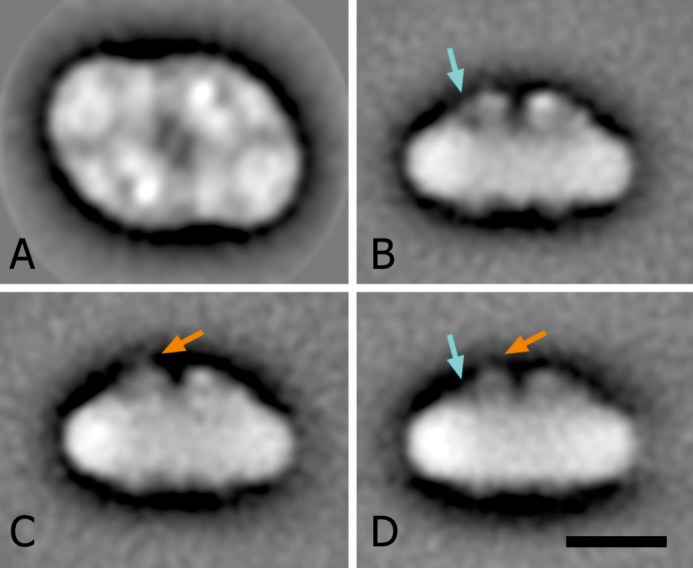
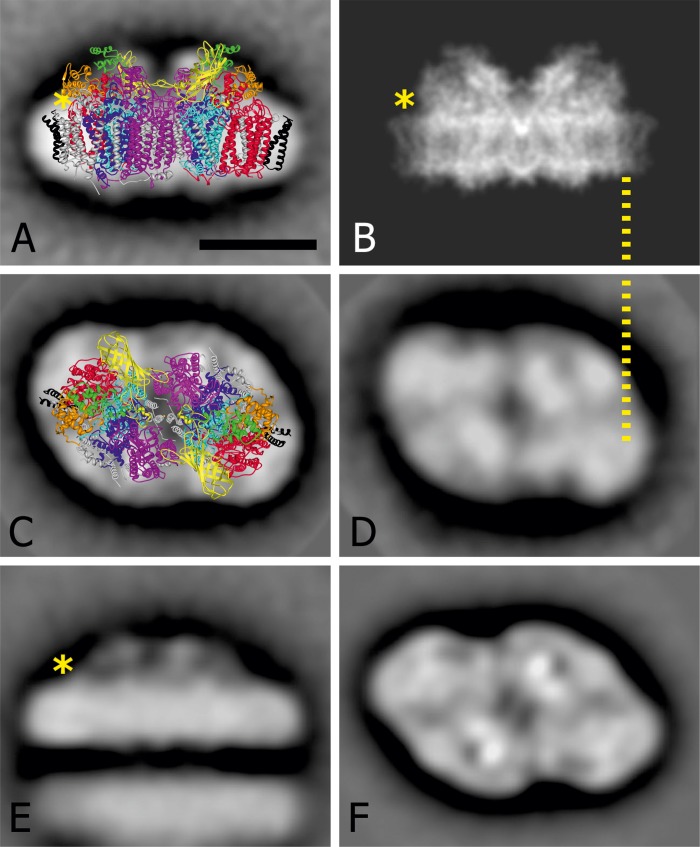
Members of the rhodophytan order Cyanidiales are unique among phototrophs in their ability to live in extremely low pH levels and moderately high temperatures. The photosynthetic apparatus of the red alga Cyanidioschyzon merolae represents an intermediate type between cyanobacteria and higher plants, suggesting that this alga may provide the evolutionary link between prokaryotic and eukaryotic phototrophs. Although we now have a detailed structural model of photosystem II (PSII) from cyanobacteria at an atomic resolution, no corresponding structure of the eukaryotic PSII complex has been published to date. Here we report the isolation and characterization of a highly active and robust dimeric PSII complex from C. merolae. We show that this complex is highly stable across a range of extreme light, temperature, and pH conditions. By measuring fluorescence quenching properties of the isolated C. merolae PSII complex, we provide the first direct evidence of pH-dependent non-photochemical quenching in the red algal PSII reaction center. This type of quenching, together with high zeaxanthin content, appears to underlie photoprotection mechanisms that are efficiently employed by this robust natural water-splitting complex under excess irradiance. In order to provide structural details of this eukaryotic form of PSII, we have employed electron microscopy and single particle analyses to obtain a 17 Å map of the C. merolae PSII dimer in which we locate the position of the protein mass corresponding to the additional extrinsic protein stabilizing the oxygen-evolving complex, PsbQ'. We conclude that this lumenal subunit is present in the vicinity of the CP43 protein, close to the membrane plane.

Keywords: Algae; Cyanidoschyzon merolae; Fluorescence; Photoprotection; Photosynthesis; Photosynthetic Pigments; Photosystem II; Single Particle Analysis.


Figures

FIGURE 1.
FIGURE 1.
Anion exchange chromatography purification of the C. merolae PSII dimer. A, AEC chromatogram from the second step of PSII purification on a DEAE ToyoPearl 650 S column. B, selected section of the AEC chromatogram (boxed in A). Elution fractions were analyzed by SEC (inset). The SEC chromatogram of every fraction analyzed is positioned directly below a circle that marks the position of the corresponding fraction in the AEC chromatogram. Consecutive SEC chromatograms show a transition between the PSII monomer and dimer (retention times of 4.15 and 3.85 min, respectively). a.u., arbitrary units.
FIGURE 2.
FIGURE 2.
Spectroscopic and compositional analyses of the C. merolae PSII dimer. Room temperature absorbance spectrum of PSII dimer (A) shows the red peak at 673 nm, characteristic of PSII. The PSII complex purity was expressed as a ratio of A673/A625 and was estimated at ∼5, confirming a complete removal of residual phycobilisomes. The 77 K steady-state fluorescence emission spectra (B) were taken at excitation wavelengths of 440 nm (solid line) and 580 nm (dashed line). The excitation wavelength of 580 nm was used to detect any residual contamination with phycobilisomes that emit fluorescence at 625 nm. The 440-nm wavelength excited Chla to produce a symmetric emission peak at 692 nm, characteristic of PSII. C, SDS-PAGE protein profile of the C. merolae PSII dimer. Samples (5 μg of Chl/lane) were resolved on a 18% Tris-Tricine gel. The positions of PsbA/C and PsbB/C as well as PsbO, PsbQ′, PsbV, and PsbU were identified by Western blotting and MS/MS analyses. The position of PsbQ′ is marked with an arrowhead in C. a.u., arbitrary units.
FIGURE 3.
FIGURE 3.
PSII activity is sustained in various extreme conditions. A, PSII maintains nearly full activity of 4,500 μmol of O2/mg of Chl/h in a relatively broad range of pH (between 5 and 6.5) with standard 5,000 μE/m2/s light intensity and 30 °C. B, when stored at 17 °C for a period of 5 days, PSII retains nearly 80% of its activity measured in standard conditions. C, PSII has a distinctive temperature optimum, with a maximum activity at 40 °C, measured in standard conditions. D, upon increasing light intensity, PSII reaches a maximum activity of ∼6,000 μmol O2/mg Chl/h at 8,000 μE/m2/s, which lowers to 3,000 μmol of O2/mg of Chl/h at 25,000 μE/m2/s. Each data point represents an average value from three independent measurements. Error bars, S.D.
FIGURE 4.
FIGURE 4.
HPLC pigment analysis of C. merolae cells and PSII dimer. Total pigments were analyzed by HPLC, and their absorbance was measured at 437 nm (for carotenoids and Chla) and at 456 nm (for carotenoids only). Peak identities are as follows. 1, Zea (cis isomer); 2, Zea; 3a, oxidized Chla; 3, Chla; 4, β-cryptoxanthin; 5, Chla′; 6, β-carotene; 7, β-carotene (cis isomer). Peaks were assigned to the corresponding pigments by LC-MS according to Ref. . Whole cell extract yielded a distinctive peak corresponding to Zea (A and B) nearly identical to the peak of Chla (A), whereas the β-carotene peak was 3-fold lower than that of Chla. The Zea abundance in the pure PSII dimer was significantly lower than in whole cells (C); however, the relative contribution of Zea and β-carotene was similar (D) when PSII was compared with the whole cell extract (see Table 1). a.u., arbitrary units.
FIGURE 5.
FIGURE 5.
Fluorescence quenching in C. merolae cells exposed to blue light. Cells were adapted for 20 min in the dark and then used for in vivo measurements of NPQ. Low intensity blue light was used (∼7 μE/m2/s; dark gray bar) to reach maximal fluorescence in the dark (FM). Quenching of maximal fluorescence upon high intensity blue light exposure (750 μE/m2/s; white bar) and its recovery in the dark (black bar) were observed. The NPQ value was calculated based on the Stern-Volmer formula, (FMFM′)/FM′. a.u., arbitrary units.
FIGURE 6.
FIGURE 6.
Non-photochemical quenching kinetics in C. merolae cells. The induction of NPQ was measured in dark-adapted cells exposed to blue light (750 μE/m2/s; white bar) followed by recovery in the dark (black bar). Curves were measured either without any inhibitors (control sample) or after the addition of an uncoupler (100 mm NH4Cl) that disrupts lumen acidification. Data represent averages and S.D. (error bars) for n = 3.
FIGURE 7.
FIGURE 7.
Dissection of the NPQ locus in C. merolae PSII. A, relative yields of minimal (F0) and variable fluorescence (FV) of isolated PSII as a function of pH. Values represent averages and S.D. values from six measurements (n = 6) done with two independent PSII isolations. Data are normalized to fluorescence parameters at pH 7.5. For pH 3 and lower, there was no detectable variable fluorescence; therefore, other physiological parameters indicating closed (FM) or opened (F0) RC were calculated only in the pH range 3.5–7.5. B, maximal quantum yield (FV/FM) and effective antennae size (σPSII) of isolated PSII as a function of pH. Values represent averages and S.D. values from six measurements (n = 6) done with two independent PSII preparations. Inset, reversibility of PSII efficiency (FV/FM) after a treatment with low pH. All values were measured at pH 7, either after 2-min treatment at low pH (2.5–3.5) followed by 4 min of recovery at pH 7 (gray bars) or directly at pH 7 without prior low pH treatment (black bar). Data represent averages and S.D. (error bars) for n = 3. a.u., arbitrary units.
FIGURE 8.
FIGURE 8.
Correlation between low pH induced maximal fluorescence quenching and inhibition of oxygen evolution in the isolated C. merolae PSII. Values of FM were normalized at pH 6 and plotted with values of PSII activity at a given pH (numerical values by the data points). A linear correlation with the correlation factor R2 = 0.89 (p = 0.0014) of both data sets was observed, indicating that within the pH range of 3.5–6.5, the loss of activity is related to quenching of fluorescence and not to irreversible damage to OEC. No such correlation was observed at pH 7 and 7.5. Error bars, S.D.
FIGURE 9.
FIGURE 9.
Projection maps of the top and side views of C. merolae. A, final projection map of the top view, as seen from the lumenal side of the membrane; the sum is composed of the best 2,048 particles, according to their correlation coefficient in the last alignment step. Two-fold rotational symmetry was imposed after analysis. B–D, averaged images of three classes of side views. The sums are composed of 493, 588, and 353 projections, respectively. As a main difference between the classes, the orange arrows indicate a stronger (C) or fainter (D) presence of the 12-kDa subunit on top of the other extrinsic subunits. Blue arrows show a stronger (B) and weaker (D) visibility of the cytochrome c550 subunit. Scale bar (A–D), 10 nm.
FIGURE 10.
FIGURE 10.
Comparison of dimeric PSII projection maps to visualize differences between C. merolae and T. elongatus at the subunit level. A and C, side and lumenal top view projection maps of the C. merolae PSII dimer particles, respectively. In A, the 1.9 Å structure of PSII from T. vulcanus (1) (Protein Data Bank coordinates 3ARC) was overlaid onto the top view EM projection map of the C. merolae complex. The D1 (PsbA) and D2 (PsbD) subunits are colored in light blue and dark blue, respectively. The CP43 (PsbC) and CP47 (PsbB) subunits are depicted in red and magenta, respectively. The PsbZ subunit is highlighted in black. The extrinsic subunits PsbV, PsbU, and PsbO are shown in orange, green, and yellow, respectively. For clarity, all remaining subunits are shown in gray. The overall size of PSII dimer particles in A is 21.2 × 11 nm. B, a high resolution structure of T. vulcanus PSII seen from aside and truncated at 8 Å resolution (1). D and E, top and side views of T. elongatus PsbZ-less PSII dimers (82); F, top view of T. elongatus PSII containing PsbZ (83). The dotted line correlates the position of an additional density with the CP43 subunit in the side view map (B) and in the top view (D). *, location where PsbQ′ is located in the C. merolae PSII complex and is absent in the T. vulcanus and the T. elongatus complex. Scale bar, 10 nm.

References

    1. Umena Y., Kawakami K., Shen J. R., Kamiya N. (2011) Crystal structure of oxygen-evolving photosystem II at a resolution of 1.9 Å. Nature 473, 55–60 - PubMed
    1. Ferreira K. N., Iverson T. M., Maghlaoui K., Barber J., Iwata S. (2004) Architecture of the photosynthetic oxygen-evolving center. Science 303, 1831–1838 - PubMed
    1. Kargul J., Maghlaoui K., Murray J. W., Deak Z., Boussac A., Rutherford A. W., Vass I., Barber J. (2007) Purification, crystallization and X-ray diffraction analyses of the T. elongatus PSII core dimer with strontium replacing calcium in the oxygen-evolving complex. Biochim. Biophys. Acta 1767, 404–413 - PubMed
    1. Murray J. W., Maghlaoui K., Kargul J., Ishida N., Lai T.-L., Rutherford A. W., Sugiura M., Boussac A., Barber J. (2008) X-ray crystallography identifies two chloride binding sites in the oxygen evolving centre of Photosystem II. Energy Environ. Sci. 1, 161–166
    1. Murray J. W., Maghlaoui K., Kargul J., Sugiura M., Barber J. (2008) Analysis of xenon binding to photosystem II by x-ray crystallography. Photosynth. Res. 98, 523–527 - PubMed

Publication types

Substances