. 2013 Aug;33(16):3377-89.
doi: 10.1128/MCB.00435-13. Epub 2013 Jun 17.

HMGN1 modulates nucleosome occupancy and DNase I hypersensitivity at the CpG island promoters of embryonic stem cells

Affiliations

HMGN1 modulates nucleosome occupancy and DNase I hypersensitivity at the CpG island promoters of embryonic stem cells

Tao Deng et al. Mol Cell Biol. 2013 Aug.

Erratum in

Abstract

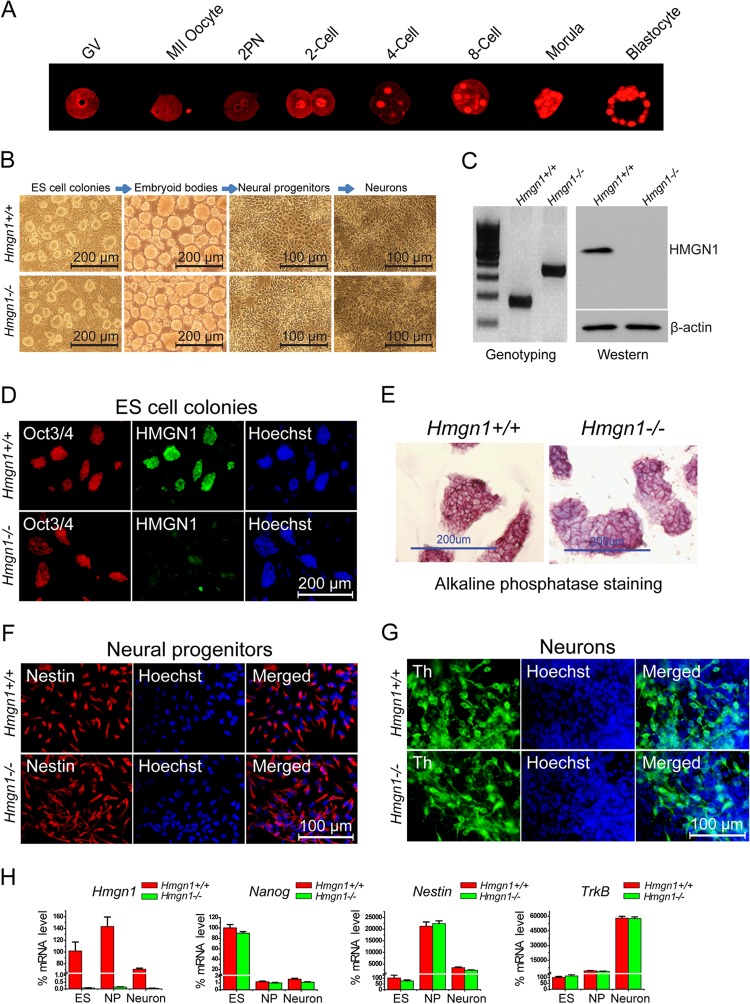
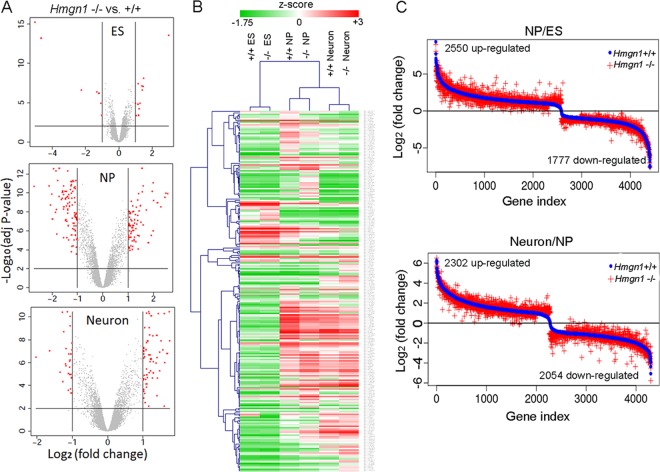
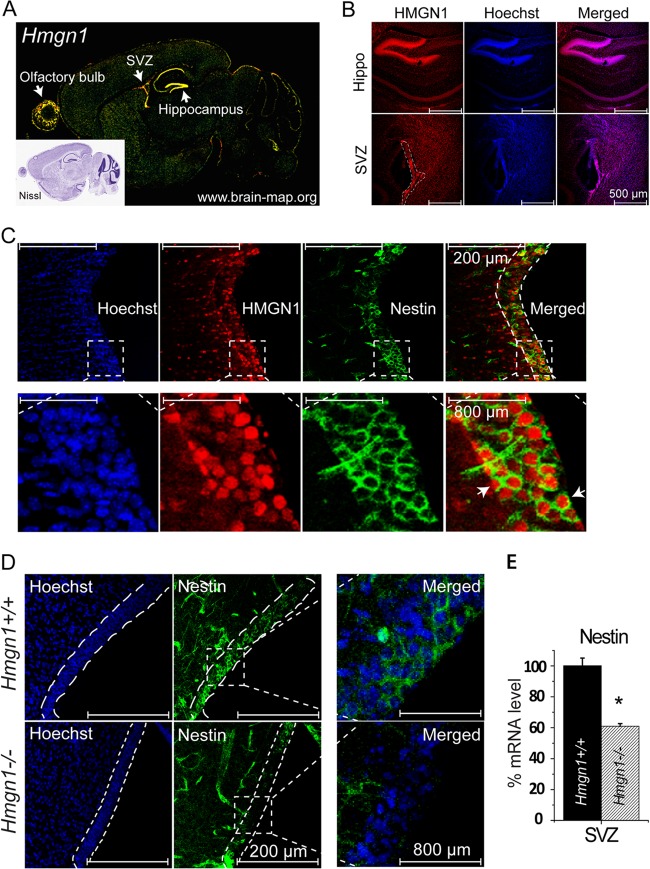
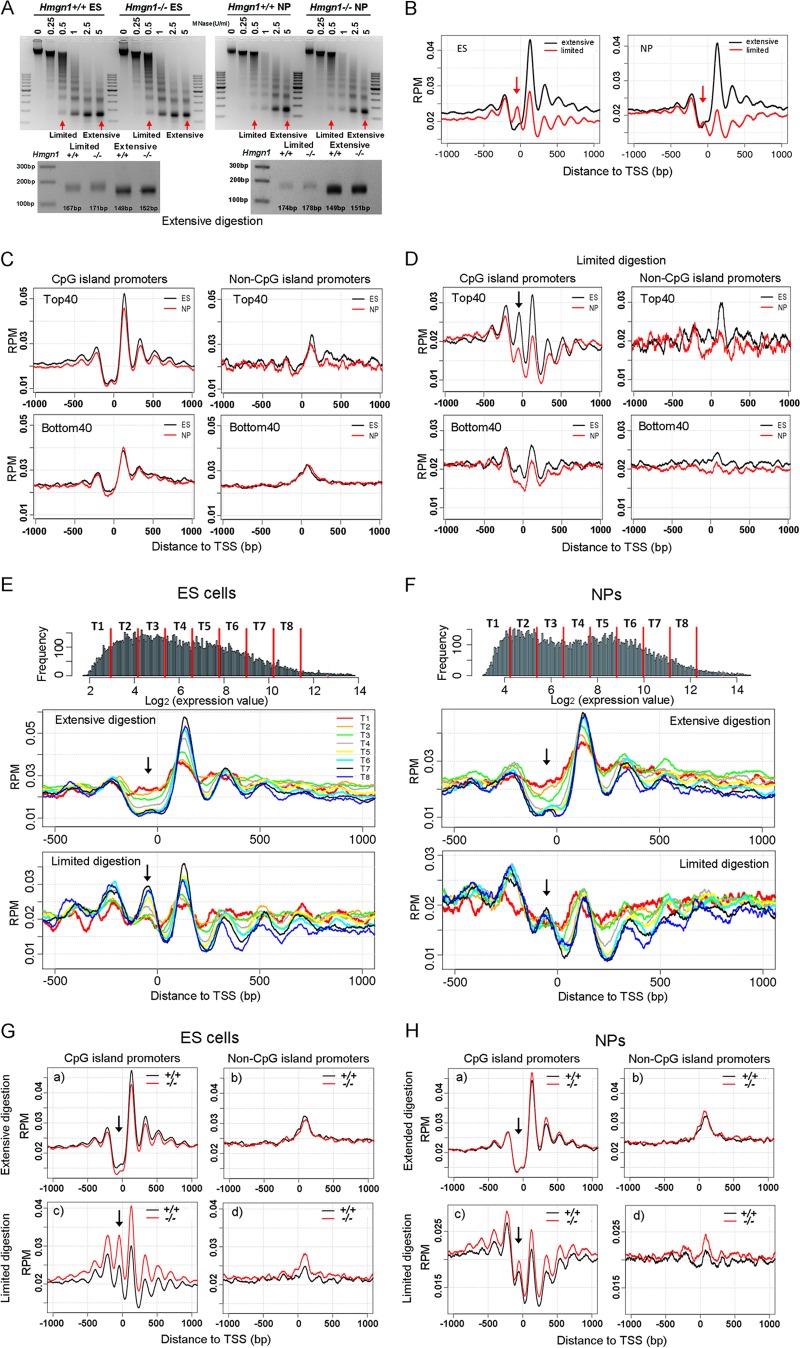
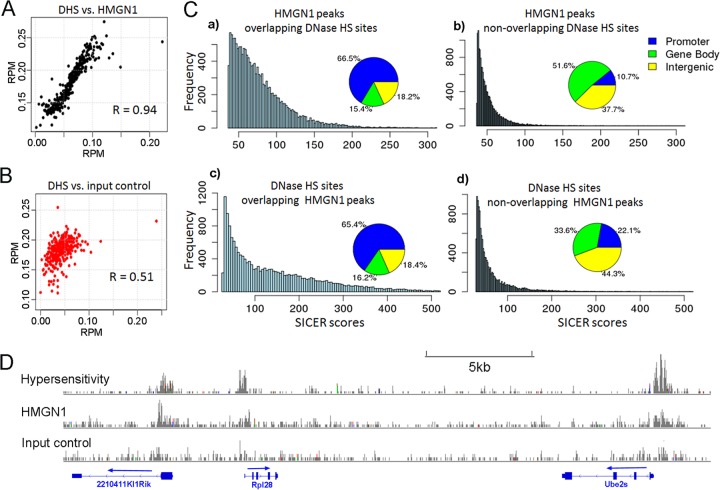
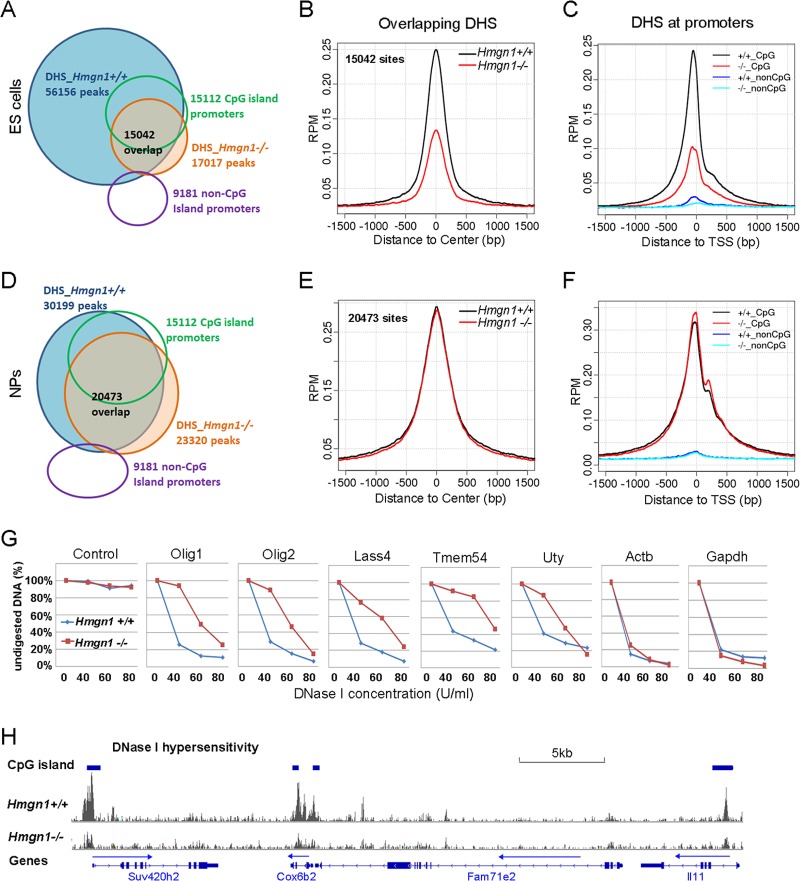
Chromatin structure plays a key role in regulating gene expression and embryonic differentiation; however, the factors that determine the organization of chromatin around regulatory sites are not fully known. Here we show that HMGN1, a nucleosome-binding protein ubiquitously expressed in vertebrate cells, preferentially binds to CpG island-containing promoters and affects the organization of nucleosomes, DNase I hypersensitivity, and the transcriptional profile of mouse embryonic stem cells and neural progenitors. Loss of HMGN1 alters the organization of an unstable nucleosome at transcription start sites, reduces the number of DNase I-hypersensitive sites genome wide, and decreases the number of nestin-positive neural progenitors in the subventricular zone (SVZ) region of mouse brain. Thus, architectural chromatin-binding proteins affect the transcription profile and chromatin structure during embryonic stem cell differentiation.


Figures

Fig 1
Fig 1
Effects of Hmgn1 depletion on in vitro ES cell differentiation. (A) HMGN1 protein expression during mouse embryonic preimplantation. Immunofluorescence images at the stages indicated above each panel are shown. (B) Morphology of Hmgn1+/+ and Hmgn1−/− ES cell colonies during differentiation along the neuronal pathway. (C) Genotyping (29) and Western analysis of the ES cells used. (D) Immunofluorescence of Oct3/4, an ES cell marker, in the ES cell colonies. (E) Both Hmgn1+/+ and Hmgn1−/− ES cell colonies express the pluripotency marker alkaline phosphatase. (F) Immunofluorescence of the neural progenitor nestin. (G) Immunofluorescence of the dopaminergic neuron marker tyrosine hydroxylase (Th). (H) Quantitiative RT-PCR analysis of the expression of Hmgn1, Nanog, Nestin, and tropomyosin-related kinase B (TrkB) during Hmgn1+/+ and Hmgn1−/− ES cell neural differentiation. The values obtained in ES cells were set to 100%.
Fig 2
Fig 2
HMGN1 depletion affects gene expression during ES cell differentiation along the neuronal pathway. (A) Transcription analysis of Hmgn1+/+ and Hmgn1−/− cells in the ES, NP, and neuron stages. Red dots mark genes (listed in Table S1A in the supplemental material) that were significantly affected by loss of HMGN1. (B) Clustering of genes (represented in panel A) across three differentiation states based on expression values. (C) Comparison of fold changes in gene expression during differentiation processes from ESCs to NPCs or NPCs to neurons in Hmgn1+/+ and Hmgn1−/− cells. The difference between red and blue visualizes the effects of HMGN1 loss on gene expression during differentiation.
Fig 3
Fig 3
Decreased nestin-positive cells in the brain of Hmgn1−/− mice. (A) High Hmgn1 expression in the subventricular zone (SVZ), hippocampus, and olfactory bulbs of mouse brain (from www.brain-map.org with permission). The inset shows the corresponding Nissl image. (B) Immunofluorescence staining in 2-week-old Hmgn1+/+ brain reveals high HMGN protein levels in mouse hippocampus and SVZ (outlined by dashes). (C) Double immunofluorescence reveals colocalization of nestin in the cytoplasm of cells expressing HMGN1 in the SVZ region. A magnified image of the area outlined by dashed lines is shown under each panel. (D) Decreased nestin immunofluorescence staining in the SVZ (outlined) of 2-week-old Hmgn1−/− mice. (E) Decreased Nestin expression in the SVZ of Hmgn1−/− mice detected by RT-PCR (*, P < 0.01).
Fig 4
Fig 4
Genome-wide distributions of HMGN1 in neural progenitor cells. (A) Global distribution of HMGN1 throughout the genome. (B) Enhanced HMGN1-binding strength at promoters. (C) HMGN1 binds to promoters containing CpG islands. Note that 92% of the HMGN1-binding promoters are CpG island promoters and that 70% of the CpG island promoters bind HMGN1, regardless of expression levels. (D) Average HMGN1 signals near the transcription start site (TSS) of different groups of genes. Black line, Top40 genes with CpG island promoters; red line, Top40 genes with non-CpG island promoters; blue line, Bot40 genes with CpG island promoters; green line, Bot40 genes with non-CpG island promoters. RPM, reads per million. The inset indicates average expression values (in log2) in the four groups of genes. (E) An example of colocalization of HMGN1, CpG island promoters, and H3K4Me3 histone mark. (F) Overlapping of HMGN1-binding promoter and H3K4Me3-positive promoters.
Fig 5
Fig 5
Nucleosome positioning at gene transcription start sites (TSS) in ES and NP cells. (A) MNase digestions of ESCs and NPCs; the sizes of the isolated monomers from limited and extensive digests are shown in the bottom panels. (B) Occupancy of nucleosome isolated from limited and extensive digests at the TSS. (C and D) Nucleosome occupancy at TSS of Top40 and Bot40 (Bottom40) genes that either do or do not contain CpG islands after extensive digestion (C) and limited digestion (D). (E and F) Correlation between nucleosome positioning at TSS and gene expression levels at ESCs (E) and NPCs (F). Genes were divided into 8 groups based on expression values (log2) as shown at the top of panels E and F. (G and H) Effects of HMGN1 depletion on nucleosome occupancy in the promoters of ESCs and NPCs. Arrows point to the position of the 0 nucleosome, located just upstream of the TSS.
Fig 6
Fig 6
Colocalization of HMGN1 and DNase I hypersensitivity sites (DHS) in neural progenitor cells. (A) Correlation between HMGN1 intensity and DNase I hypersensitivity at all DHS. Average coverage depths (of HMGN1 or hypersensitivity) were calculated at all DNase I-hypersensitive regions. Data, including the corresponding DNase I hypersensitivity data points, were sorted by HMGN coverage depth and then grouped into 100 data point bins and averaged. The Pearson correlation coefficient (R) was calculated for the binned data. (B) Correlation between input signal and DNase hypersensitivity at the same regions. (C) Distributions of HMGN1 peaks that either do or do not overlap DNase HS sites (top two panels) and DNase HS sites that either do or do not overlap HMGN1 peaks (bottom). Note that the overlapping regions have stronger signal intensities and are mostly located in gene promoters. (D) An example of colocalization between HMGN1, DNase I hypersensitivity, and gene promoters.
Fig 7
Fig 7
Reduced DNase I hypersensitivity in Hmgn1−/− ES cells. (A) DHS in Hmgn1+/+ and Hmgn1−/− ESCs. (B) Decreased DNase I in Hmgn1−/− ESCs. Data represent intensities measured at sites that overlap that are present in both Hmgn1+/+ and Hmgn1−/− cells. (C) Loss of HMGN1 decreases the DNase I sensitivity at CpG promoters of ESCs. (D) DHS in Hmgn1+/+ and Hmgn1−/− NP cells. (E) HMGN1 does not affect the DHS in NP cells. (F) HMGN1 does not affect the DHS at the CpG promoters in NP cells. (G) Quantitative PCR validation of DNase I-seq results in ES cells. The results determined with a control taken from a region that is not digested by DNase I verify that equal amounts of DNA were loaded for Hmgn1+/+ and Hmgn1−/− cells. (H) A genome browser view of DNase I hypersensitivity of Hmgn1+/+ and Hmgn1−/− ES cells.

References

    1. Li M, Liu GH, Izpisua Belmonte JC. 2012. Navigating the epigenetic landscape of pluripotent stem cells. Nat. Rev. Mol. Cell Biol. 13:524–535 - PubMed
    1. Mattout A, Meshorer E. 2010. Chromatin plasticity and genome organization in pluripotent embryonic stem cells. Curr. Opin. Cell Biol. 22:334–341 - PubMed
    1. Shah SN, Kerr C, Cope L, Zambidis E, Liu C, Hillion J, Belton A, Huso DL, Resar LM. 2012. HMGA1 reprograms somatic cells into pluripotent stem cells by inducing stem cell transcriptional networks. PLoS One 7:e48533.10.1371/journal.pone.0048533 - DOI - PMC - PubMed
    1. Young RA. 2011. Control of the embryonic stem cell state. Cell 144:940–954 - PMC - PubMed
    1. Zhang Y, Cooke M, Panjwani S, Cao K, Krauth B, Ho PY, Medrzycki M, Berhe DT, Pan C, McDevitt TC, Fan Y. 2012. Histone h1 depletion impairs embryonic stem cell differentiation. PLoS Genet. 8:e1002691.10.1371/journal.pgen.1002691 - DOI - PMC - PubMed

Publication types

MeSH terms