

Pesticides reduce regional biodiversity of stream invertebrates
- PMID: 23776226
- PMCID: PMC3704006
- DOI: 10.1073/pnas.1305618110
Pesticides reduce regional biodiversity of stream invertebrates
Abstract
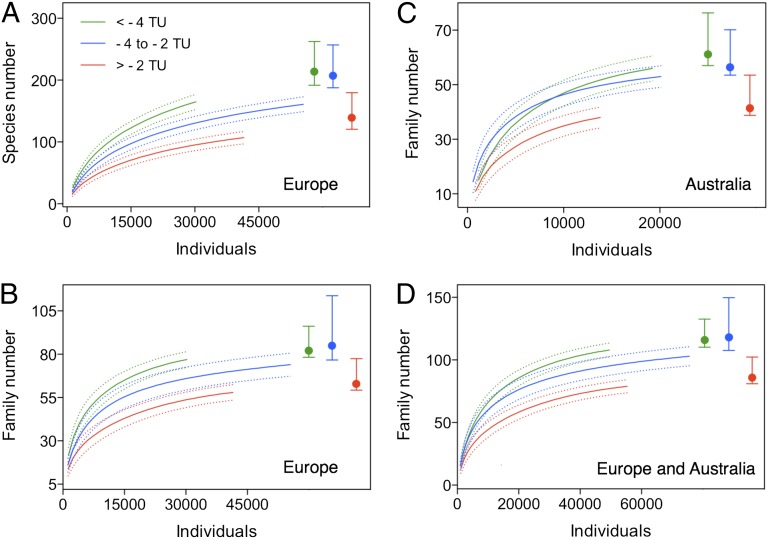
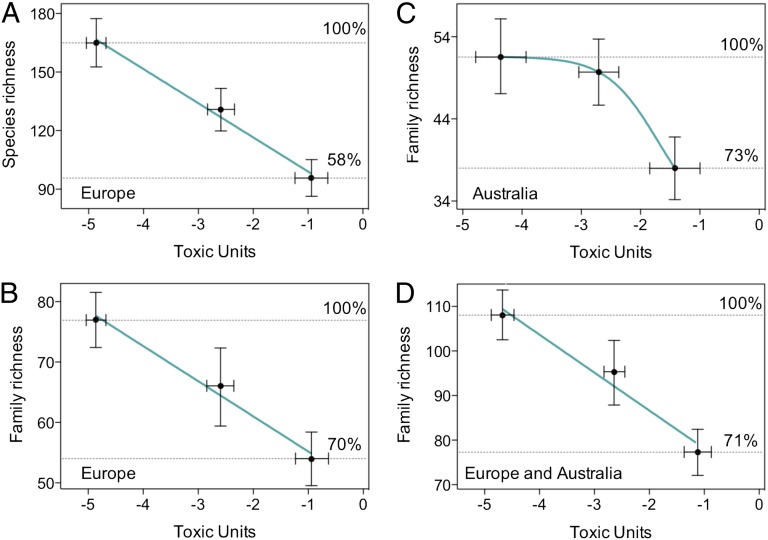
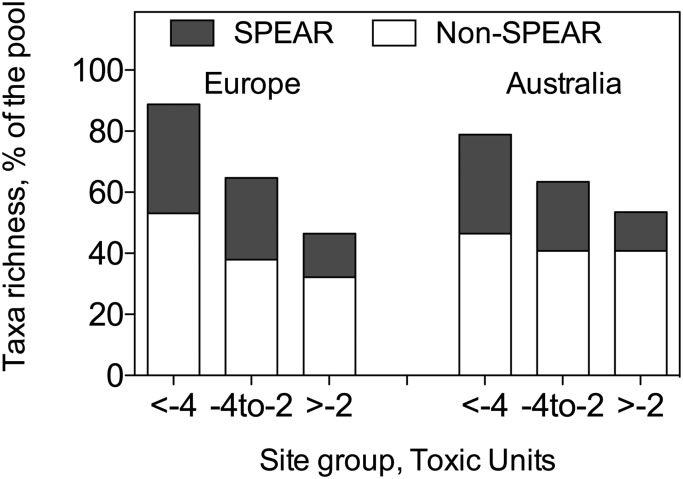
The biodiversity crisis is one of the greatest challenges facing humanity, but our understanding of the drivers remains limited. Thus, after decades of studies and regulation efforts, it remains unknown whether to what degree and at what concentrations modern agricultural pesticides cause regional-scale species losses. We analyzed the effects of pesticides on the regional taxa richness of stream invertebrates in Europe (Germany and France) and Australia (southern Victoria). Pesticides caused statistically significant effects on both the species and family richness in both regions, with losses in taxa up to 42% of the recorded taxonomic pools. Furthermore, the effects in Europe were detected at concentrations that current legislation considers environmentally protective. Thus, the current ecological risk assessment of pesticides falls short of protecting biodiversity, and new approaches linking ecology and ecotoxicology are needed.
Keywords: environmental impacts; environmental risk assessment; macroinvertebrates; plant protection products; spatial scale.
Conflict of interest statement
The authors declare no conflict of interest.
Figures
References
-
- Millenium Ecosystem Assessment . Ecosystems and Human Well-Being: Biodiversity Synthesis. Washington, DC: World Resources Institute; 2005.
-
- United Nations (2008) Millennium Development Goals Indicators. Available at http://unstats.un.org/unsd/mdg/Host.aspx? Content=Indicators/OfficialList.htm. Accessed June 1, 2012.
-
- Secretariat of the Convention on Biological Diversity . Global Biodiversity Outlook 3. Montreal: CBD; 2010.
-
- Secretariat of the Convention on Biological Diversity (2003) Handbook of the Convention on Biological Diversity (Earthscan, CBD, London)
-
- Butchart SHM, et al. Global biodiversity: Indicators of recent declines. Science. 2010;328(5982):1164–1168. - PubMed
Publication types
MeSH terms
Substances
LinkOut - more resources
Full Text Sources
Other Literature Sources
Medical
