. 2013 Jul 2;110(27):11163-8.
doi: 10.1073/pnas.1216954110. Epub 2013 Jun 17.

Optimal sampling of visual information for lightness judgments

Affiliations

Optimal sampling of visual information for lightness judgments

Matteo Toscani et al. Proc Natl Acad Sci U S A. .

Abstract

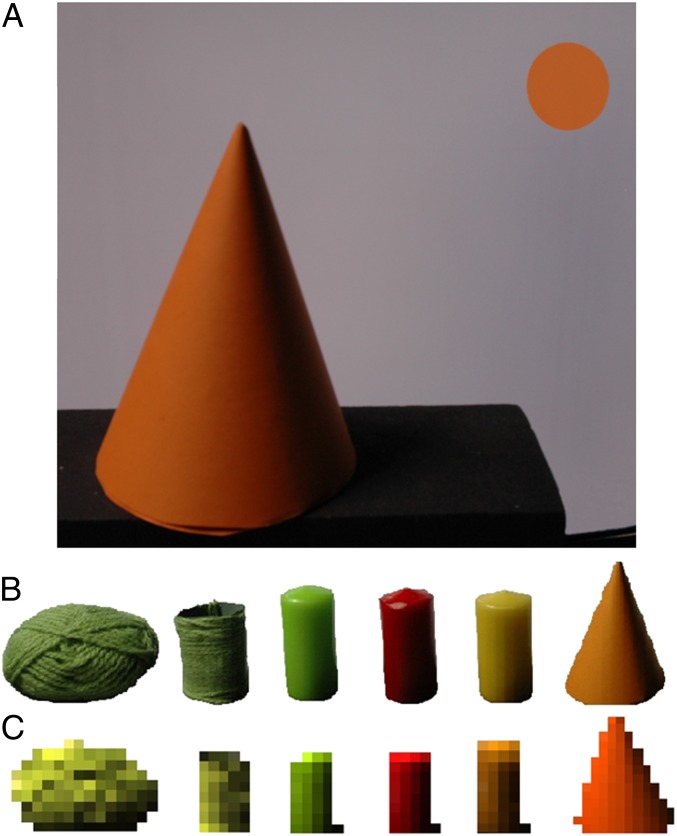
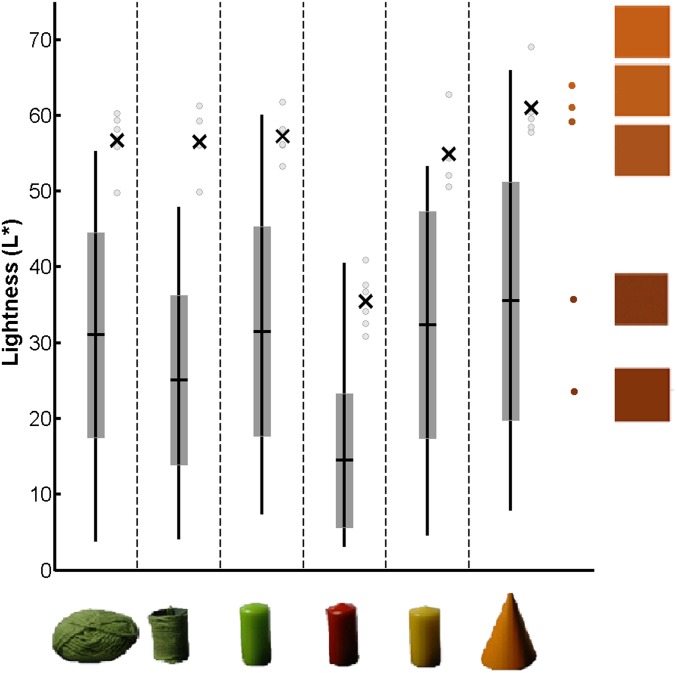
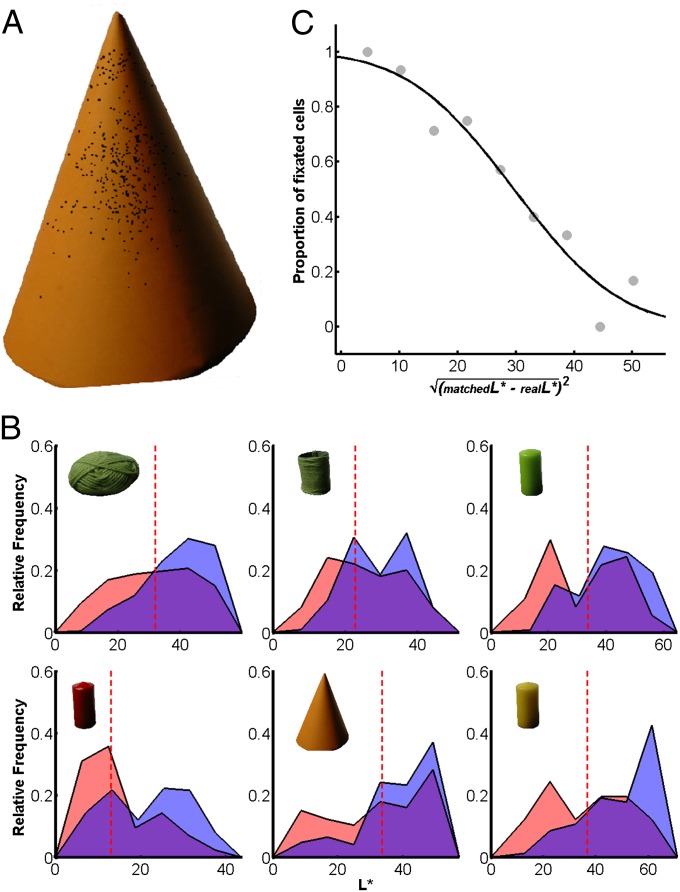
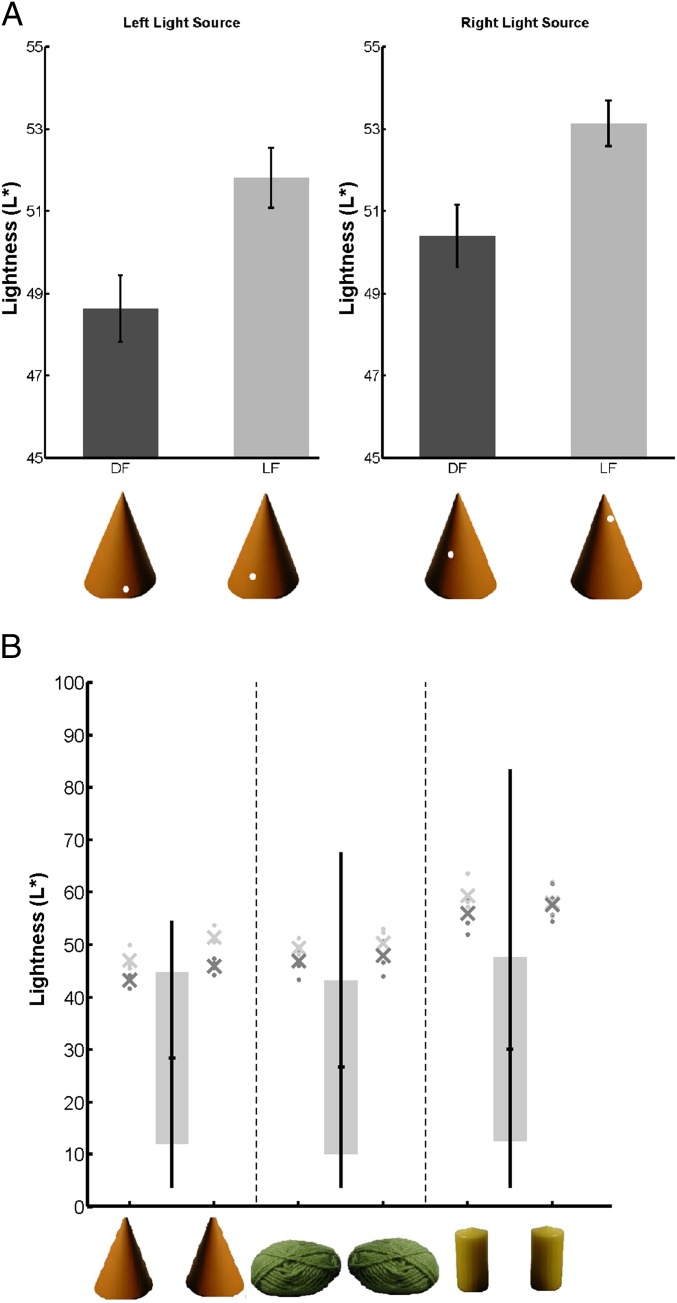
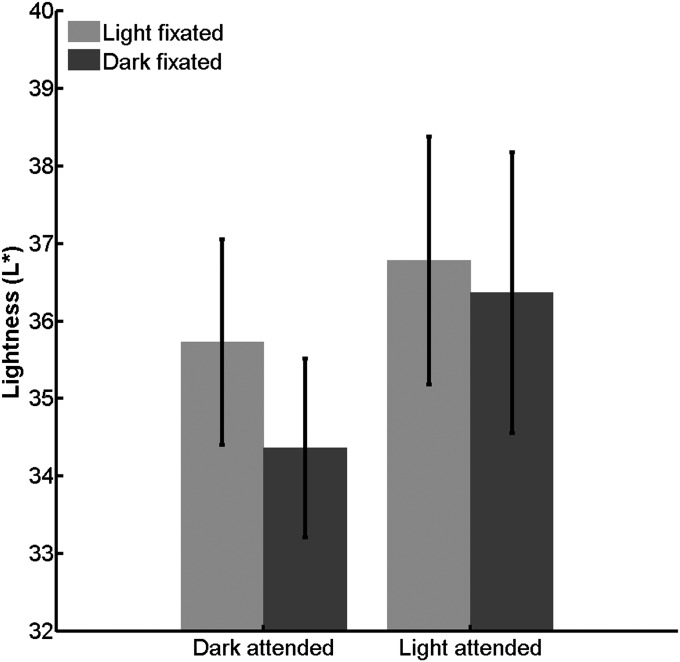
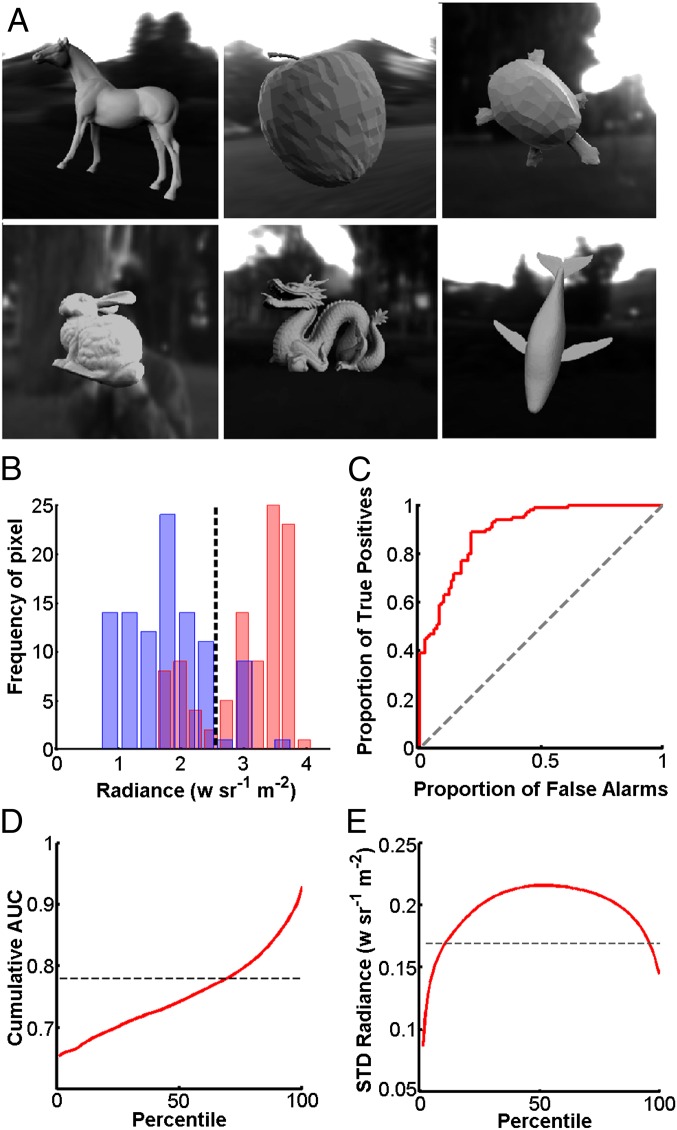
The variable resolution and limited processing capacity of the human visual system requires us to sample the world with eye movements and attentive processes. Here we show that where observers look can strongly modulate their reports of simple surface attributes, such as lightness. When observers matched the color of natural objects they based their judgments on the brightest parts of the objects; at the same time, they tended to fixate points with above-average luminance. When we forced participants to fixate a specific point on the object using a gaze-contingent display setup, the matched lightness was higher when observers fixated bright regions. This finding indicates a causal link between the luminance of the fixated region and the lightness match for the whole object. Simulations with rendered physical lighting show that higher values in an object's luminance distribution are particularly informative about reflectance. This sampling strategy is an efficient and simple heuristic for the visual system to achieve accurate and invariant judgments of lightness.

Keywords: attention; lightness constancy; lightness perception; visual perception.


Conflict of interest statement

The authors declare no conflict of interest.

Figures

Fig. 1.
Fig. 1.
(A) Photograph of the matching setup. The image shows the paper cone together with the matching disk on the upper right of the cathode ray tube (CRT)-monitor. (B) Real objects we used. From left to right, green wool ball, green wool cylinder (same wool), green candle, red candle, yellow candle, and orange paper cone. (C) Spectroradiometric measurements. Spectral images obtained by measuring the objects superimposed on a 22 × 34-cell grid. For reproduction purposes, spectral data have been transformed to RGB (red-green-blue) values.
Fig. 2.
Fig. 2.
Object lightness distribution and lightness (L*) matches. Gray circles represent the mean object matches from each of the six observers. Black crosses represent the mean matches for each object averaged across the observers. The gray bars represent the mean ±1 SD and the black vertical lines represent the range of the distribution of L* within the objects. The colored squares to the right show the orange paper cone under several different illumination conditions. From top to bottom: paper oriented perpendicular to light source, mean match, maximum within the object, average within object, paper mounted on the CRT screen.
Fig. 3.
Fig. 3.
(A) Example of fixations on an object (orange paper cone) during the color-matching task. Fixations falling outside the object area are not shown. (B) Relative frequencies of fixations and lightness (L*) for the six objects. The red histogram depicts the L* distribution within the object area, with the vertical dashed line indicating its median. The blue histogram depicts the distribution of the L* values associated with fixations (pooled across all observers). (C) Probability of fixation as a function of distance from the matched color for all spectral matrix cells. This example refers to one object and one observer. The example represents the probability for a cell to be fixated at least once, as a function of the difference between the matched and the spectrally measured L* for the given cell. Symbols represent the proportion of fixated points in ten bins.
Fig. 4.
Fig. 4.
(A) Lightness matches in the LF and in the DF condition: means and SEs of the matches. (Left) Data for images with a light gradient from the left side to the right; (Right) data for images with the opposite gradient. Black vertical bars represent the SEs. The four pictures at the bottom represent examples of the stimuli with the white dot indicating the fixated area. (B) Dark gray and light gray circles represent the mean object matches from each of the six observers, respectively, in the DF and in the LF condition. Dark and light crosses represent the mean matches for each object averaged across the observers, respectively, in the DF and LF condition. The gray bars represent the mean ±1 SD and the black vertical lines represent the range of the distribution of L* within the objects. Matches are always within the ranges.
Fig. 5.
Fig. 5.
Role of attention. Plot of the means and SEs of the points of subjective equal lightness obtained when observers compared a test disk and the objects' images presented on a computer screen. Gray bars represent the data in the light and black bars in the DF condition. The two bars on the left represent the data when attention was directed to the dark point, whereas the bars on the right represent the data obtained when attention was directed to the light point. The points of subjective equal lightness were on average higher when the observers fixated on the light point (light gray bars) and when the observers attended to the light region (bars on the right).
Fig. 6.
Fig. 6.
Results of the physically based rendering simulation. (A) Set of 3D models of objects used in the simulation. (B) Single percentile distributions. The histograms represent the two distributions of the radiances (output of the rendering software), 100 different orientations for a certain percentile. These distributions are clearly overlapping. (C) ROC curve. The ROC curve is plotted for the two distributions of B. The AUC is close to 1, indicating high discriminability. (D) Classification performances for each percentile. The highest percentiles’ aggregated discrimination performance is higher than the performance of the discrimination based on the object average luminance (dashed black line). (E) SD for each percentile. Extreme percentiles are more stable.

References

    1. Weber EH. (1834) De Pulsu, resorptione, auditu et tactu: Annotationes anatomicae et physiologicae [On Heartbeat, Digestion, Audition and Touch: Anatomical and Physiological Comments](CF Koehler, Leipzig). Latin.
    1. Fechner G. Über ein wichtiges psychophysisches Grundgesetz und dessen Beziehung zur Schätzung der Sterngrössen. Sächs Abhandl. 1859;4:455–532.
    1. Adelson EH, Pentland AP. In: Perception as Baysian Inference. Knill D, Richards W, editors. 1996. (Cambridge University Press, New York), pp 409–423.
    1. Mach E. Über die physiologische Wirkung räumlich verteilter Lichtreize [On the physiological effect of spatially distributed light stimuli] Wiener Sitzungsber Math-Naturwiss Cl Kaiserlichen Akad Wiss. 1868;57:1–11. German.
    1. Cornsweet T. Visual Perception. New York: Academic; 1966.

Publication types

LinkOut - more resources