. 2013 Jun 12;8(6):e65723.
doi: 10.1371/journal.pone.0065723. Print 2013.

Transcription factors in Escherichia coli prefer the holo conformation

Affiliations

Transcription factors in Escherichia coli prefer the holo conformation

Yalbi Itzel Balderas-Martínez et al. PLoS One. .

Erratum in

  • PLoS One. 2013;8(8). doi:10.1371/annotation/96d7b9a4-aa2e-4593-ae8a-7c14d134e29c

Abstract

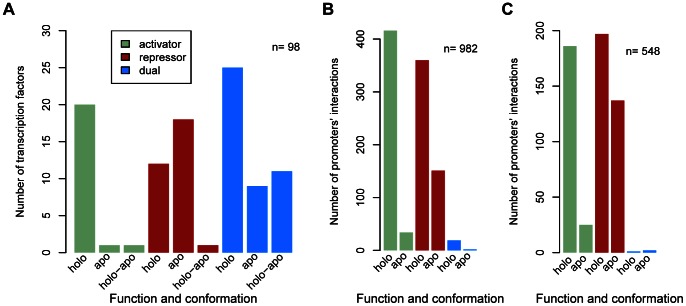
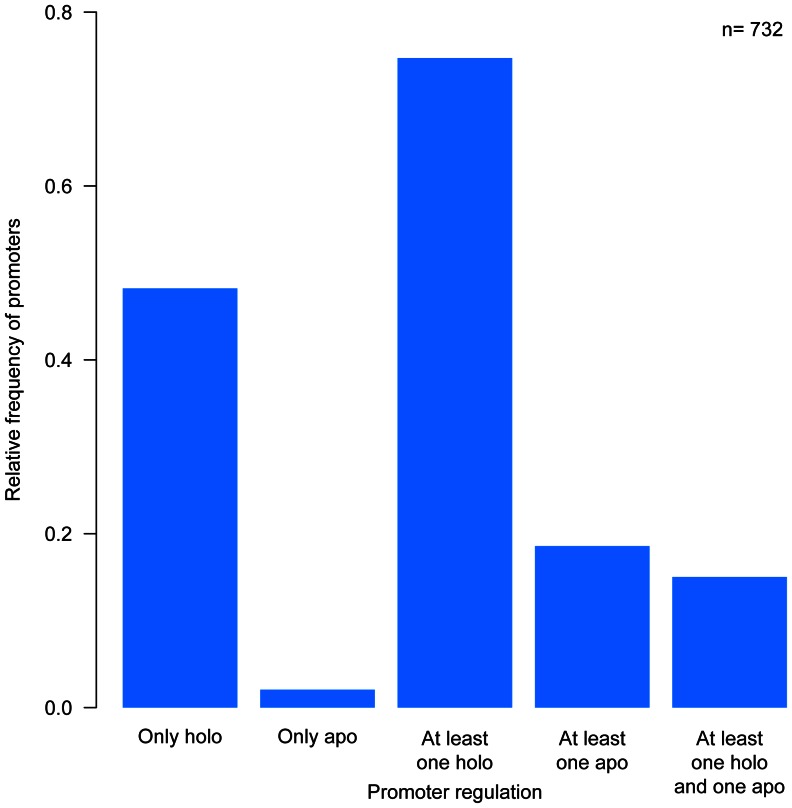
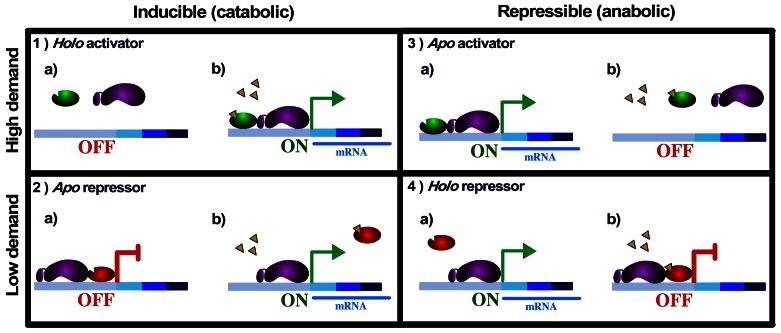
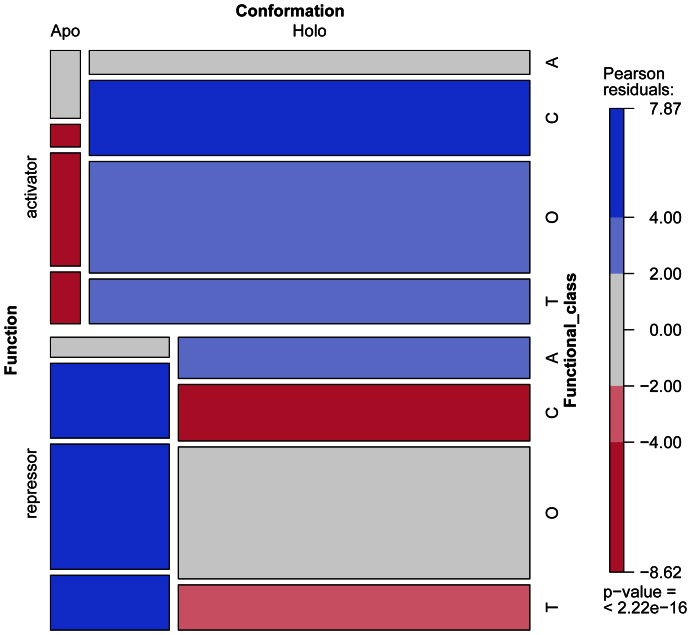
The transcriptional regulatory network of Escherichia coli K-12 is among the best studied gene networks of any living cell. Transcription factors bind to DNA either with their effector bound (holo conformation), or as a free protein (apo conformation) regulating transcription initiation. By using RegulonDB, the functional conformations (holo or apo) of transcription factors, and their mode of regulation (activator, repressor, or dual) were exhaustively analyzed. We report a striking discovery in the architecture of the regulatory network, finding a strong under-representation of the apo conformation (without allosteric metabolite) of transcription factors when binding to their DNA sites to activate transcription. This observation is supported at the level of individual regulatory interactions on promoters, even if we exclude the promoters regulated by global transcription factors, where three-quarters of the known promoters are regulated by a transcription factor in holo conformation. This genome-scale analysis enables us to ask what are the implications of these observations for the physiology and for our understanding of the ecology of E. coli. We discuss these ideas within the framework of the demand theory of gene regulation.


Conflict of interest statement

Competing Interests: The authors have declared that no competing interests exist.

Figures

Figure 1
Figure 1. Conformational asymmetries.
(a) Conformational asymmetries of TFs. TFs were classified based on the mode of control (activators: green; repressors: red; dual regulators: blue) and the functional conformation (holo, apo, or holo-apo). Pearson’s chi-squared test: χ2 = 29.0212, df = 4, P = 7.74×10−06. (b) Conformational asymmetries in TF functional conformation-promoter pairs. TF functional conformation-promoter pairs were classified according to the mode of control (activation: green, repression: red, dual: blue) and the functional conformation (holo, apo, or holo-apo) of the TF. Activating interaction pairs may come from TFs that are either activators or from promoters that are activated by dual TFs; repressing interaction pairs may come from repressor TFs or from promoters negatively regulated by dual TFs. Dual interaction pairs refer here exclusively to interactions by a TF with a dual effect on the same promoter. Pearson’s chi-squared test: χ2 = 76.3451, df = 2, P<2.2×10⁻¹⁶. (c) Effect of excluding global TFs on conformational asymmetries of TF functional conformation-promoter pairs. Only TF-promoter interactions where the TF is local are here counted. If a promoter is subject both to local and global regulation, those interactions with local TFs contribute to this counting. Interactions, excluding those by global regulators. They were classified according to the mode of control (activation: green; repression: red; dual: blue) and functional conformation (holo, apo, or holo-apo) of the TF. Pearson’s chi-squared test: χ2 = 79.4576, df = 4, P = 2.269×10⁻¹⁶.
Figure 2
Figure 2. Complex regulation and TF conformational tendency.
With this classification system, we considered promoters to be regulated by one or more TFs, but each of them with the same mode and conformation. Each bar corresponds to the relative frequency of a promoter regulated by at least one TF only in holo functional conformation, only in apo functional conformation, at least one TF in holo, at least one TF in apo conformation, or at least one TF in holo and one in apo conformation. The colors inside each bar correspond to the contributions by promoters subject to only one TF, two, three or more.
Figure 3
Figure 3. Predicted gene control circuits for simple cases.
Case 1. Inducible catabolic high-demand system. a) Expression of the regulated genes is OFF, because the activator is in a nonfunctional state. b) In the presence of the effector, it binds to the activator, changing it to the holo conformation, which facilitates transcription, e.g., maltotriose binds to MalT and this induces maltose operon expression. Case 2. Inducible catabolic low-demand system. a) The repressor is functional in the apo conformation, so the system is repressed in the absence of the effector. b) In the presence of the effector, it binds to the TF, changing it to a nonfunctional conformation, which allows induction of the system, e.g., allolactose binds to LacI and this induces lactose operon expression. Case 3. Repressible anabolic high-demand system. a) In the absence of the effector, the system is ON, with the activator in the apo conformation. b) When the effector is present, the activator is nonfunctional and the system is deactivated, e.g., Cbl activates the tau and ssi operons when it is unbound to the adenosyl 5′-phosphosulfate compound. Case 4. Repressible anabolic low-demand system. a) The repressor is nonfunctional in the absence of effector, so gene expression is turned ON. b) In the presence of effector, it binds to the TF, converting it to the holo conformation, which binds DNA and represses transcription, e.g., TrpR bound to tryptophan in the holo conformation represses the tryptophan operon. Symbols: ON and OFF show gene expression and a lack of gene expression, respectively. Activator: green oval; repressor: red oval; RNA polymerase: purple bean shape; effector: yellow triangles; mRNA: blue line.
Figure 4
Figure 4. Gene classification based on MultiFun and TF conformational bias.
Each gene was classified by its regulation, on the function of the TF (activator or repressor), the conformation (apo or holo), and functional class (T: transport; O: others; C: catabolic; A: anabolic). This plot represents a contingency table, with each rectangle corresponding to a piece of the plot, with their sizes proportional to the cell entry. The Pearson residuals indicate the fit of a log-linear model. Blue represents the maximum significance of the corresponding residual, and red shows the minimum.

References

    1. Salgado H, Peralta-Gil M, Gama-Castro S, Santos-Zavaleta A, Muñiz-Rascado L, et al. (2013) RegulonDB v8.0: omics data sets, evolutionary conservation, regulatory phrases, cross-validated gold standards and more. Nucleic Acids Research 41: D203–D213. - PMC - PubMed
    1. Gutiérrez-Ríos RM, Rosenblueth DA, Loza JA, Huerta AM, Glasner JD, et al. (2003) Regulatory Network of Escherichia coli: Consistency Between Literature Knowledge and Microarray Profiles. Genome Res 13: 2435–2443. - PMC - PubMed
    1. Wall ME, Hlavacek WS, Savageau MA (2004) Design of gene circuits: lessons from bacteria. Nat Rev Genet 5: 34–42. - PubMed
    1. Savageau MA (1998) Demand Theory of Gene Regulation. I. Quantitative Development of the Theory. Genetics 149: 1665–1676. - PMC - PubMed
    1. Savageau MA (1998) Demand Theory of Gene Regulation. II. Quantitative Application to the Lactose and Maltose Operons of Escherichia coli. Genetics 149: 1677–1691. - PMC - PubMed

Publication types

MeSH terms

Substances

LinkOut - more resources