. 2013 Jun 11;8(6):e65922.
doi: 10.1371/journal.pone.0065922. Print 2013.

Functional assessment of population and tumor-associated APE1 protein variants

Affiliations

Functional assessment of population and tumor-associated APE1 protein variants

Jennifer L Illuzzi et al. PLoS One. .

Abstract

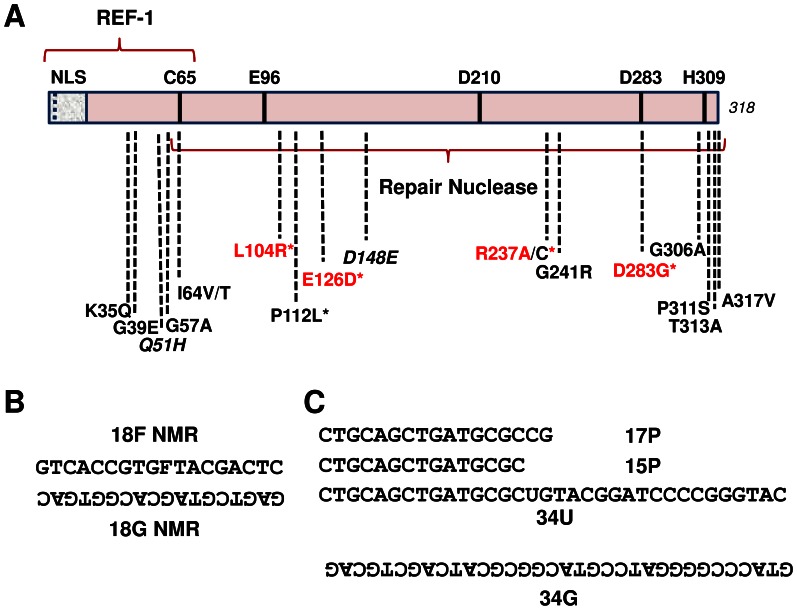
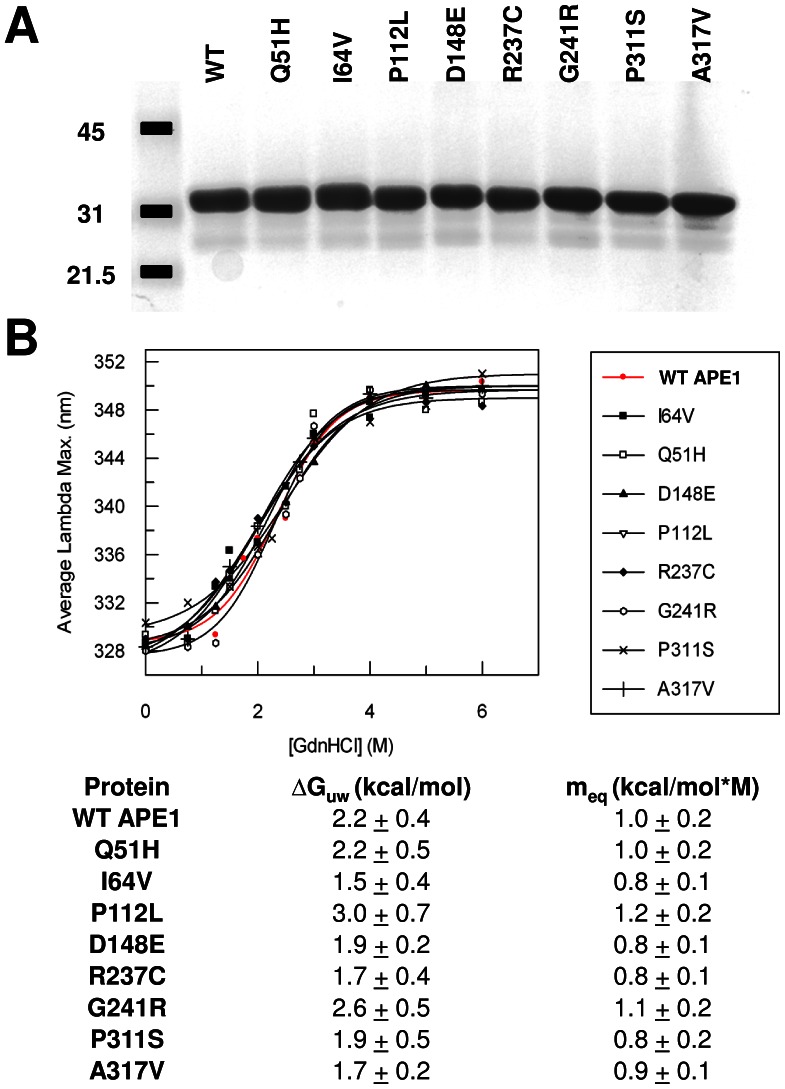
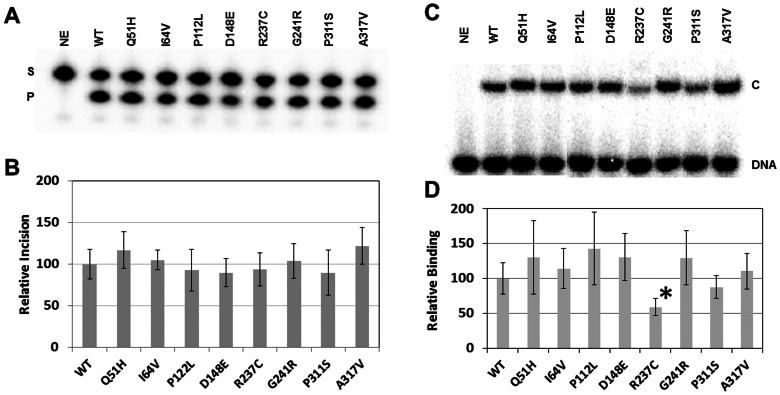
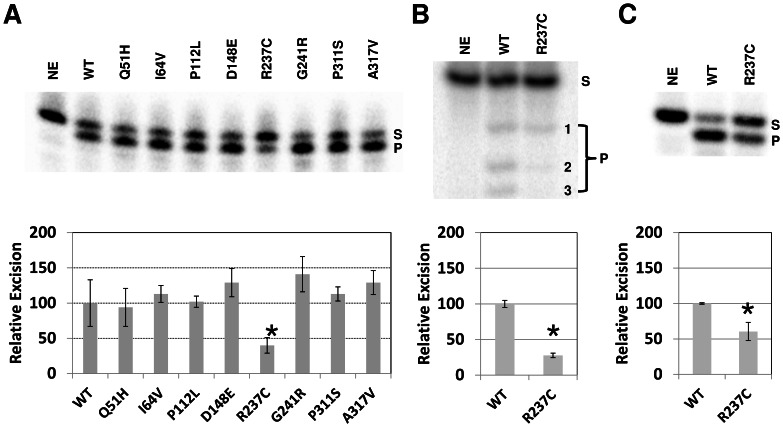
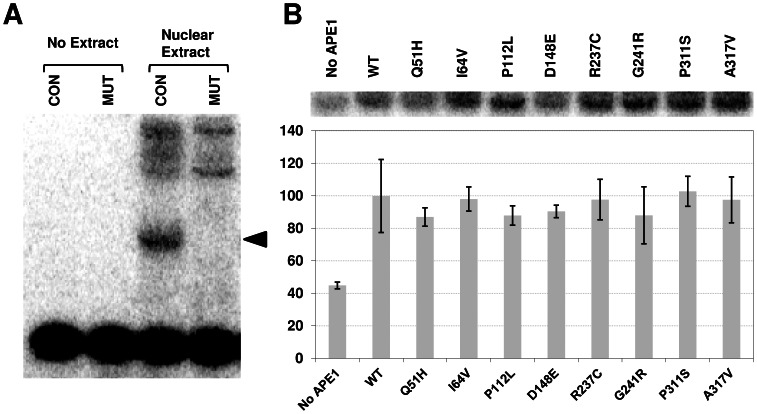
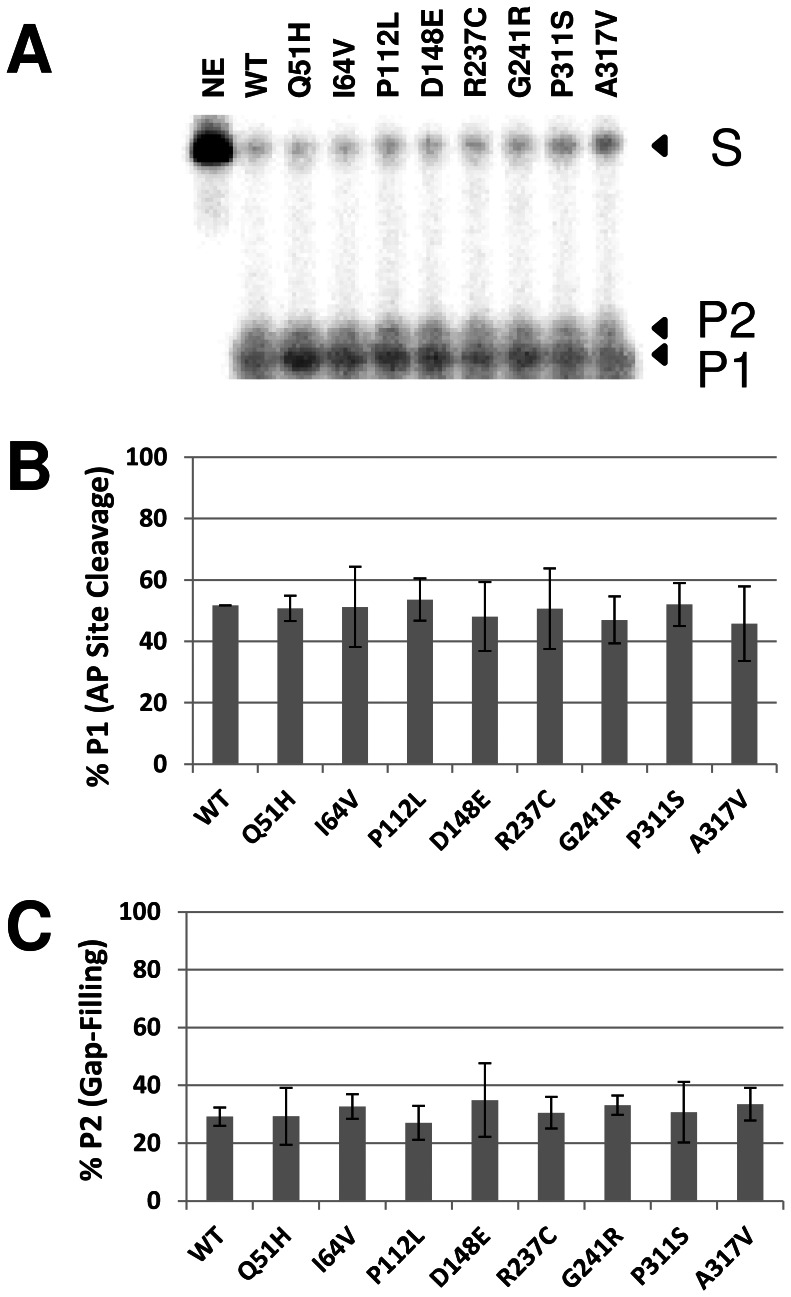
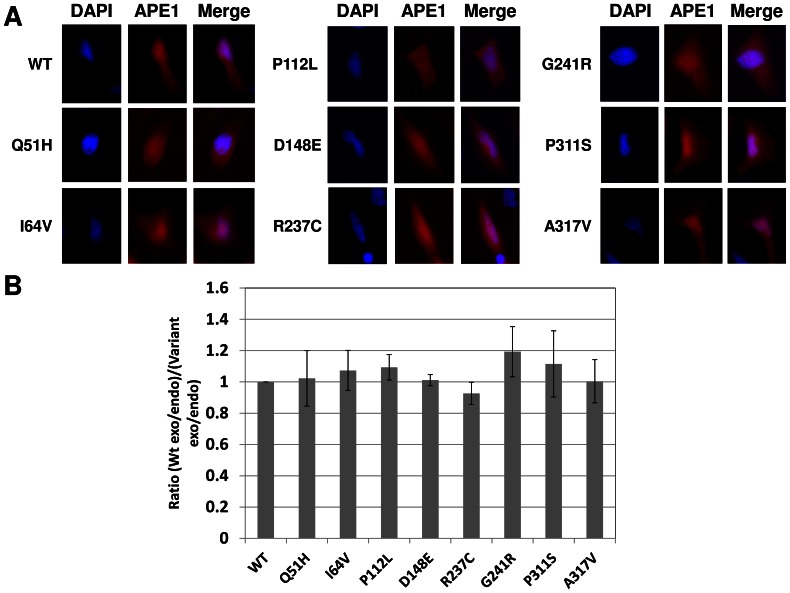
Apurinic/apyrimidinic endonuclease 1 (APE1) is the predominant AP site repair enzyme in mammals. APE1 also maintains 3'-5' exonuclease and 3'-repair activities, and regulates transcription factor DNA binding through its REF-1 function. Since complete or severe APE1 deficiency leads to embryonic lethality and cell death, it has been hypothesized that APE1 protein variants with slightly impaired function will contribute to disease etiology. Our data indicate that except for the endometrial cancer-associated APE1 variant R237C, the polymorphic variants Q51H, I64V and D148E, the rare population variants G241R, P311S and A317V, and the tumor-associated variant P112L exhibit normal thermodynamic stability of protein folding; abasic endonuclease, 3'-5' exonuclease and REF-1 activities; coordination during the early steps of base excision repair; and intracellular distribution when expressed exogenously in HeLa cells. The R237C mutant displayed reduced AP-DNA complex stability, 3'-5' exonuclease activity and 3'-damage processing. Re-sequencing of the exonic regions of APE1 uncovered no novel amino acid substitutions in the 60 cancer cell lines of the NCI-60 panel, or in HeLa or T98G cancer cell lines; only the common D148E and Q51H variants were observed. Our results indicate that APE1 missense mutations are seemingly rare and that the cancer-associated R237C variant may represent a reduced-function susceptibility allele.


Conflict of interest statement

Competing Interests: The authors have declared that no competing interests exist.

Figures

Figure 1
Figure 1. APE1 protein variants and oligonucleotide substrates.
(A) Linear schematic of the 318 residue APE1 protein, including several reported amino acid substitutions. NLS = nuclear localization sequence; REF-1 = redox regulatory portion of the protein; italics = polymorphic variants; * = unique disease-associated variants; red text = variants with reduced AP endonuclease activity. The repair nuclease domain and several functionally important amino acids (C65, E96, D210, D283 and H309) are indicated. See Table 1 for additional details. (B) The 18F NMR and 18G NMR oligonucleotides were used to design the double-stranded AP endonuclease substrate. (C) The 15P or 17P oligonucleotide was annealed to the 34G oligonucleotide to generate a 3′-recessed exonuclease/repair substrate, whereas the 34U oligonucleotide was annealed to 34G to create the uracil-containing duplex for the reconstitution assay. Oligonucleotides are written 5′ to 3′, with the non-labeled strands written upside-down. F = the AP site analog, tetrahydrofuran.
Figure 2
Figure 2. Variant proteins and thermodynamic stability of folding as determined by chemical denaturation.
(A) Following purification, wild-type (WT) and variant APE1 proteins were quantified and analyzed (1 µg) by SDS-polyacrylamide gel electrophoresis and Coomassie blue staining. Shown is a representative gel image. Molecular mass standards are indicated to the left in kDa. (B) Profile of maximum wavelength emission for tryptophan fluorescence relative to GdnHCl concentration for the wild-type (WT) and variant APE1 proteins (top). The free energies of protein unfolding in the absence of denaturant (ΔGuw) and the values reflecting the dependence of the free energy on denaturant concentration (meq) are shown (bottom).
Figure 3
Figure 3. AP endonuclease incision and AP-DNA binding.
(A) Wild-type (WT) and variant APE1 proteins (30 pg) were incubated with 32P-labeled 18F NMR DNA substrate (0.5 pmol), and the reactions were resolved on a urea-polyacrylamide denaturing gel. The non-incised substrate (S) and incision product (P) bands were visualized and quantified using standard phosphorimaging analysis. NE = no enzyme. (B) Relative AP site incision efficiency. Shown are the average and standard deviations of at least 6 independent reactions. (C) Wild-type (WT) and variant APE1 proteins (2 ng) were incubated with 32P-labeled 18F NMR DNA (100 fmol), and the binding reactions were resolved on a non-denaturing polyacrylamide gel. Standard phosphorimager analysis was employed to visualize unbound substrate (DNA) and the APE1-substrate complex (C). NE = no enzyme. (D) Relative AP-DNA binding affinity. Shown are the average and standard deviations of relative complex formation for at least 4 independent assays. *, p = 0.002.
Figure 4
Figure 4. Exonuclease and 3′-repair assay.
(A) Wild-type (WT) and variant APE1 proteins (250 ng) were incubated with 32P-labeled partially duplex 15P/34G DNA substrate (0.5 pmol), and the reactions were resolved on a high resolution denaturing sequencing gel (top). Substrate (S) and exonuclease degraded product (P) were visualized and quantified using standard phosphorimaging analysis. NE = no enzyme. Graph of relative 3′ to 5′ exonuclease efficiency is shown (bottom), depicting the average and standard deviations of 4 independent experiments. *, p = 0.01. (B) Partial duplex 17P/34G substrate (0.5 pmol) was incubated with APE1 proteins (250 ng) and products were resolved on a high resolution denaturing sequencing gel. Products were detected using phosphorimaging analysis. Densitometry results are graphed below from 3 independent assays. *, p = 0.0009. (C) The 3′-phosphate partial duplex 15-p/34G DNA substrate (0.5 pmol) was incubated with APE1 proteins (1 ng) and products were resolved on a high resolution denaturing sequencing gel. Densitometry results are graphed below from 3 independent assays. *, p = 0.01.
Figure 5
Figure 5. REF-1 assay.
(A) HCT116 nuclear extract was incubated with 32P-labeled consensus (CON) or mutant (MUT) AP-1 oligonucleotide substrates, and binding reactions were resolved on a non-denaturing polyacrylamide gel. Control reactions without nuclear extract (no extract) are shown. The arrow designates the position of the AP-1-specific consensus binding complex, not seen with the MUT double-stranded DNA. Higher molecular weight non-specific complexes are observed. (B) Reduced wild-type (WT) or variant APE1 protein was incubated with HCT116 nuclear extract in the presence of the 32P-labeled AP-1 CON DNA substrate. Shown is the AP-1-specific complex in the absence (no protein) or presence of the indicated reduced APE1 protein after phosphorimager analysis. Plotted is the relative AP-1 DNA binding activity, in comparison with reduced WT protein. Values represent the average and standard deviation of 3 independent experimental points.
Figure 6
Figure 6. Reconstitution assay using purified BER proteins.
(A) Wild-type (WT) and variant APE1 proteins were incubated with UDG and POLβ with 32P-labeled 34U DNA substrate (1 pmol), and the reactions were resolved on a urea-polyacrylamide denaturing sequencing gel. The non-incised substrate (S), AP site incision product (P1), and gap-filling extension product (P2) were visualized and quantified using standard phosphorimaging analysis. NE = no enzyme. (B) Relative AP site cleavage efficiency. Shown are the averages and standard deviations of 4 independent reactions. (C) Relative gap-filling activity. Shown are the average and standard deviation of 4 independent assays.
Figure 7
Figure 7. Intracellular localization of APE1 protein variants.
(A) Representative microscopy images of the mCherry APE1 fusion proteins following plasmid transfection into HeLa cells. Shown are the DAPI nuclear staining, mCherry fusion protein fluorescence and the merged images. (B) Comparative cytoplasm to nuclear distribution for the different mCherry APE1 proteins. Using densitometry, the ratio of exogenous cytoplasmic mCherry-tagged wild-type (WT) APE1 protein to endogenous cytoplasmic protein was divided by the ratio of exogenous nuclear mCherry-tagged WT APE1 protein to endogenous nuclear protein, and this value was designated as 1. The identical ratio was then determined for each of the APE1 variant proteins, and plotted relative to the WT value. Shown is the average and standard deviation of results from 3 separate extract preparations and western blot experiments.

References

    1. Lindahl T (1993) Instability and decay of the primary structure of DNA. Nature 362: 709–715. - PubMed
    1. Loeb LA, Preston BD (1986) Mutagenesis by apurinic/apyrimidinic sites. Ann Rev Genet 20: 201–230. - PubMed
    1. Fortini P, Dogliotti E (2007) Base damage and single-strand break repair: mechanisms and functional significance of short- and long-patch repair subpathways. DNA Repair (Amst) 6: 398–409 S1568–7864(06)00317-X [pii];10.1016/j.dnarep.2006.10.008 [doi] - DOI - PubMed
    1. Robertson AB, Klungland A, Rognes T, Leiros I (2009) DNA repair in mammalian cells: Base excision repair: the long and short of it. Cell Mol Life Sci 66: 981–993. - PMC - PubMed
    1. Wilson DM, Kim D, Berquist BR, Sigurdson AJ (2011) Variation in base exision repair capacity. Mutat Res 711: 100–112. - PMC - PubMed

Publication types

Substances