

SweeD: likelihood-based detection of selective sweeps in thousands of genomes
- PMID: 23777627
- PMCID: PMC3748355
- DOI: 10.1093/molbev/mst112
SweeD: likelihood-based detection of selective sweeps in thousands of genomes
Abstract
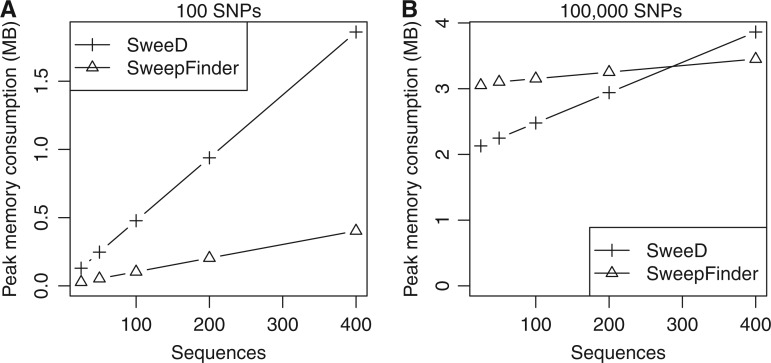
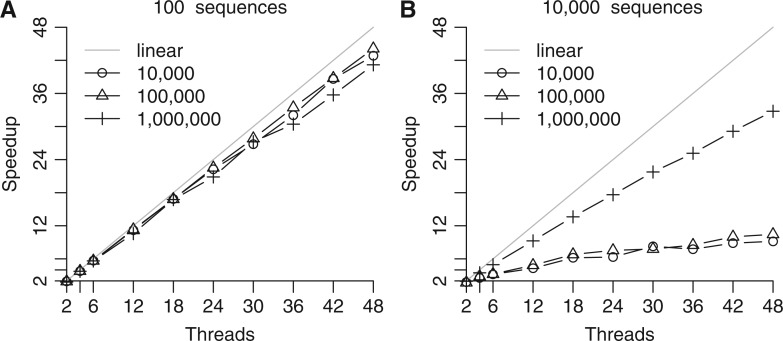
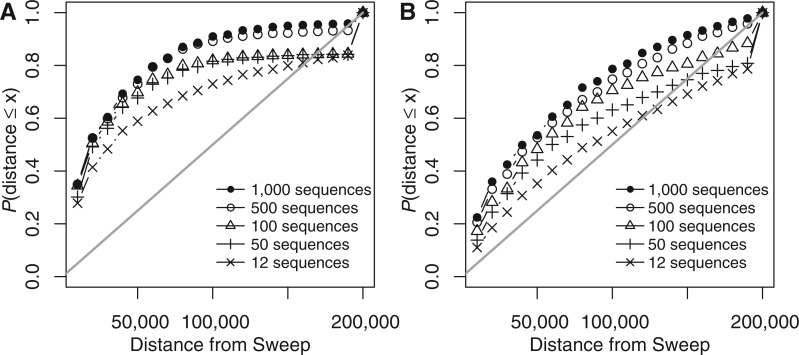
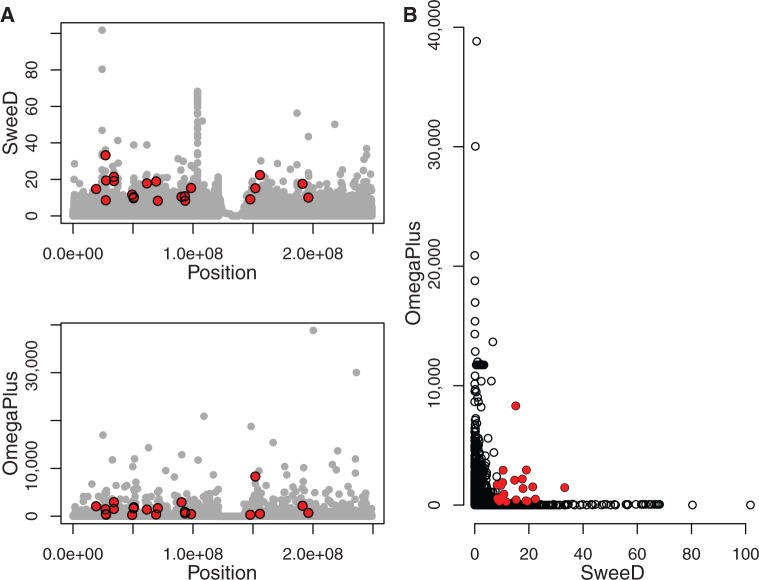
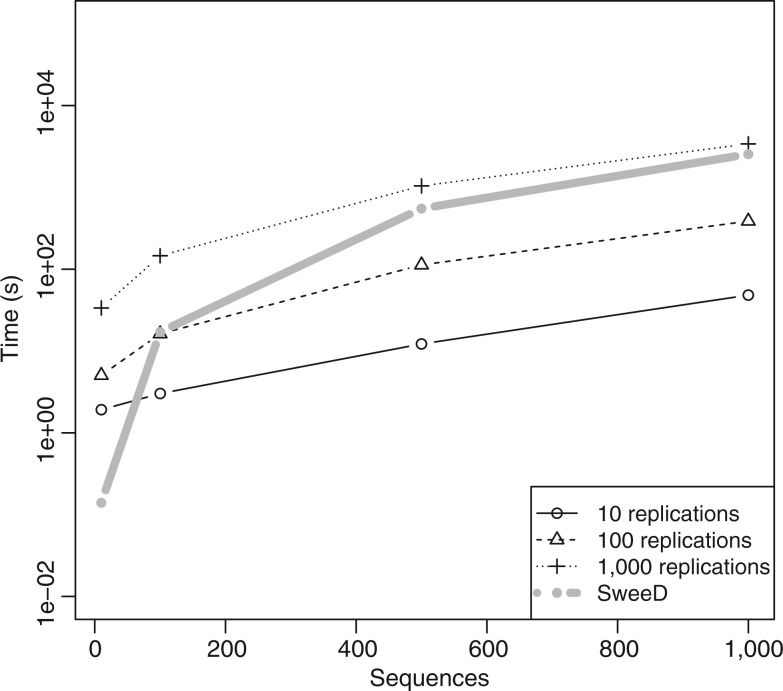
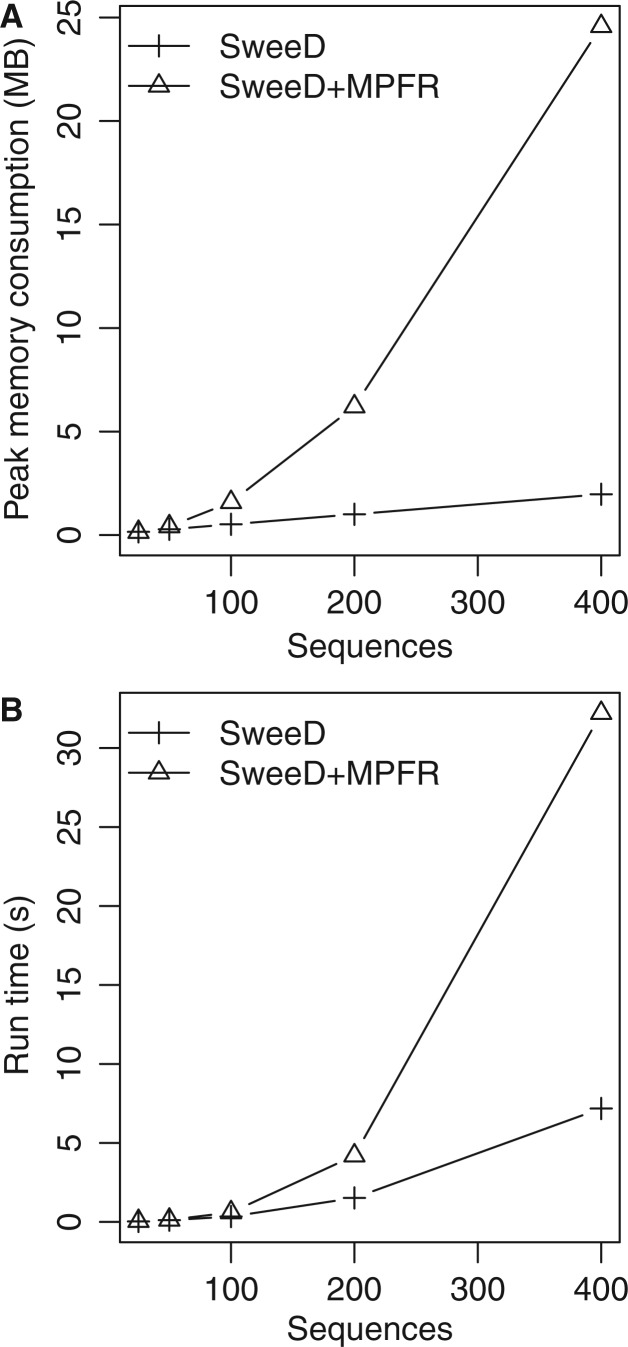
The advent of modern DNA sequencing technology is the driving force in obtaining complete intra-specific genomes that can be used to detect loci that have been subject to positive selection in the recent past. Based on selective sweep theory, beneficial loci can be detected by examining the single nucleotide polymorphism patterns in intraspecific genome alignments. In the last decade, a plethora of algorithms for identifying selective sweeps have been developed. However, the majority of these algorithms have not been designed for analyzing whole-genome data. We present SweeD (Sweep Detector), an open-source tool for the rapid detection of selective sweeps in whole genomes. It analyzes site frequency spectra and represents a substantial extension of the widely used SweepFinder program. The sequential version of SweeD is up to 22 times faster than SweepFinder and, more importantly, is able to analyze thousands of sequences. We also provide a parallel implementation of SweeD for multi-core processors. Furthermore, we implemented a checkpointing mechanism that allows to deploy SweeD on cluster systems with queue execution time restrictions, as well as to resume long-running analyses after processor failures. In addition, the user can specify various demographic models via the command-line to calculate their theoretically expected site frequency spectra. Therefore, (in contrast to SweepFinder) the neutral site frequencies can optionally be directly calculated from a given demographic model. We show that an increase of sample size results in more precise detection of positive selection. Thus, the ability to analyze substantially larger sample sizes by using SweeD leads to more accurate sweep detection. We validate SweeD via simulations and by scanning the first chromosome from the 1000 human Genomes project for selective sweeps. We compare SweeD results with results from a linkage-disequilibrium-based approach and identify common outliers.
Keywords: high-performance computing; positive selection; selective sweep; site frequency spectrum.
Figures
Similar articles
-
Detecting Positive Selection in Populations Using Genetic Data.Methods Mol Biol. 2020;2090:87-123. doi: 10.1007/978-1-0716-0199-0_5. Methods Mol Biol. 2020. PMID: 31975165
-
Scalable linkage-disequilibrium-based selective sweep detection: a performance guide.Gigascience. 2016 Feb 8;5:7. doi: 10.1186/s13742-016-0114-9. eCollection 2016. Gigascience. 2016. PMID: 26862394 Free PMC article.
-
A survey of methods and tools to detect recent and strong positive selection.J Biol Res (Thessalon). 2017 Apr 8;24:7. doi: 10.1186/s40709-017-0064-0. eCollection 2017 Dec. J Biol Res (Thessalon). 2017. PMID: 28405579 Free PMC article. Review.
-
McSwan: A joint site frequency spectrum method to detect and date selective sweeps across multiple population genomes.Mol Ecol Resour. 2019 Jan;19(1):283-295. doi: 10.1111/1755-0998.12957. Epub 2018 Nov 22. Mol Ecol Resour. 2019. PMID: 30358170
-
Signatures of positive selection: from selective sweeps at individual loci to subtle allele frequency changes in polygenic adaptation.Mol Ecol. 2016 Jan;25(1):79-88. doi: 10.1111/mec.13288. Epub 2015 Jul 27. Mol Ecol. 2016. PMID: 26108992 Review.
Cited by
-
Detection of selection signatures in farmed coho salmon (Oncorhynchus kisutch) using dense genome-wide information.Sci Rep. 2021 May 6;11(1):9685. doi: 10.1038/s41598-021-86154-w. Sci Rep. 2021. PMID: 33958603 Free PMC article.
-
Deciphering the Genetic Landscape: Insights Into the Genomic Signatures of Changle Goose.Evol Appl. 2024 Aug 22;17(8):e13768. doi: 10.1111/eva.13768. eCollection 2024 Aug. Evol Appl. 2024. PMID: 39175938 Free PMC article.
-
Forty Years of Inferential Methods in the Journals of the Society for Molecular Biology and Evolution.Mol Biol Evol. 2024 Jan 3;41(1):msad264. doi: 10.1093/molbev/msad264. Mol Biol Evol. 2024. PMID: 38197288 Free PMC article.
-
Genomic analyses provide insights into peach local adaptation and responses to climate change.Genome Res. 2021 Apr;31(4):592-606. doi: 10.1101/gr.261032.120. Epub 2021 Mar 9. Genome Res. 2021. PMID: 33687945 Free PMC article.
-
Extensive crop-wild hybridization during Brassica evolution and selection during the domestication and diversification of Brassica crops.Genetics. 2023 Apr 6;223(4):iyad027. doi: 10.1093/genetics/iyad027. Genetics. 2023. PMID: 36810660 Free PMC article.
References
-
- Alachiotis N, Stamatakis A, Pavlidis P. OmegaPlus: a scalable tool for rapid detection of selective sweeps in whole-genome datasets. Bioinformatics. 2012;28:2274–2275. - PubMed
-
- Ansel J, Arya K, Cooperman G. 23rd IEEE International Parallel and Distributed Processing Symposium (IPDPS’09). IEEE (Montreal, Canada) 2009. DMTCP: transparent checkpointing for cluster computations and the desktop; pp. 1–12.
-
- Evans SN, Shvets Y, Slatkin M. Non-equilibrium theory of the allele frequency spectrum. Theor Popul Biol. 2007;71:109–119. - PubMed
Publication types
MeSH terms
LinkOut - more resources
Full Text Sources
Other Literature Sources
Molecular Biology Databases
Miscellaneous
