Sequencing and validation of housekeeping genes for quantitative real-time PCR during the gonadotrophic cycle of Diploptera punctata
- PMID: 23777660
- PMCID: PMC3750588
- DOI: 10.1186/1756-0500-6-237
Sequencing and validation of housekeeping genes for quantitative real-time PCR during the gonadotrophic cycle of Diploptera punctata
Abstract
Background: Quantitative RT-PCR (q-RT-PCR) is a powerful tool that allows for the large scale analysis of small changes in gene expression. Accurate and reliable results depend on the use of stable reference genes for normalization. However, the expression of some widely used housekeeping genes can vary under different experimental setups. To our knowledge, no validation studies have been reported for reference genes in cockroaches. The aim of the current study is the identification and validation of a set of eight housekeeping genes during the first gonadotrophic cycle of the cockroach, Diploptera punctata. This study made use of two different algorithms (geNorm and Normfinder) to evaluate the stability of gene expression.
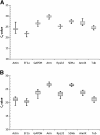
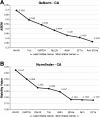
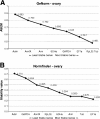
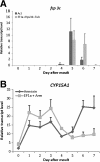
Results: Candidate housekeeping genes were sequenced: β-actin (Actin), elongation factor 1 alpha (EF1a), glyceraldehyde-3-phosphate dehydrogenase (GAPDH), armadillo (Arm), ribosomal protein L32 (RpL32), succinate dehydrogenase (SDHa), annexin IX (AnnIX) and α-tubulin (Tub). The expression of these eight genes was analyzed in corpora allata (CA) and ovaries of adult female D. punctata. Both geNorm, as well as Normfinder characterized SDHa, EF1a and Arm as being the most stably expressed in the corpora allata. In the ovary, the geNorm calculation showed Tub, EF1a and RpL32 to be most stable, whereas Normfinder identified Tub, EF1a and Arm as the best. In ovary, the least stable gene was Actin, challenging its usefulness in normalization. As a proof of principle, the expression of follicle cell protein 3c and CYP15A1 was monitored during the first gonadotrophic cycle.
Conclusion: Arm and EF1a form the most stably expressed combination of two reference genes out of the eight candidates that were tested in the corpora allata. Our results show that the combined use of Tub, EF1a and RpL32 ensures an accurate normalization of gene expression levels in ovary of D. punctata. Our study has indicated that neither Actin nor AnnIX should be used for normalization of transcript levels when studying the first gonadotrophic cycle in CA or ovary of D. punctata. The results stress the necessity for validation of reference genes in q-RT-PCR studies in cockroaches.
Figures


Similar articles
-
Assessment and validation of a suite of reverse transcription-quantitative PCR reference genes for analyses of density-dependent behavioural plasticity in the Australian plague locust.BMC Mol Biol. 2011 Feb 16;12:7. doi: 10.1186/1471-2199-12-7. BMC Mol Biol. 2011. PMID: 21324174 Free PMC article.
-
The validation of housekeeping genes as a reference in quantitative Real Time PCR analysis: application in the milk somatic cells and frozen whole blood of goats infected with caprine arthritis encephalitis virus.Gene. 2014 Oct 10;549(2):280-5. doi: 10.1016/j.gene.2014.07.063. Epub 2014 Jul 25. Gene. 2014. PMID: 25068405
-
Expression stability and selection of optimal reference genes for gene expression normalization in early life stage rainbow trout exposed to cadmium and copper.Aquat Toxicol. 2017 Sep;190:217-227. doi: 10.1016/j.aquatox.2017.07.009. Epub 2017 Jul 24. Aquat Toxicol. 2017. PMID: 28763741
-
RPLP0/TBP are the most stable reference genes for human dental pulp stem cells under osteogenic differentiation.World J Stem Cells. 2024 Jun 26;16(6):656-669. doi: 10.4252/wjsc.v16.i6.656. World J Stem Cells. 2024. PMID: 38948092 Free PMC article.
-
Resolving the current controversy of use and reuse of housekeeping proteins in ageing research: Focus on saving people's tax dollars.Ageing Res Rev. 2024 Sep;100:102437. doi: 10.1016/j.arr.2024.102437. Epub 2024 Jul 25. Ageing Res Rev. 2024. PMID: 39067773 Free PMC article. Review.
Cited by
-
Evaluation of Reference Genes for Normalization of RT-qPCR Gene Expression Data for Trichoplusia ni Cells During Antheraea pernyi (Lepidoptera: Saturniidae) Multicapsid Nucleopolyhedrovirus (AnpeNPV) Infection.J Insect Sci. 2019 Jan 1;19(1):4. doi: 10.1093/jisesa/iey133. J Insect Sci. 2019. PMID: 30624703 Free PMC article.
-
Molecular chaperone Jiv promotes the RNA replication of classical swine fever virus.Virus Genes. 2017 Jun;53(3):426-433. doi: 10.1007/s11262-017-1448-9. Epub 2017 Mar 24. Virus Genes. 2017. PMID: 28341934
-
Forkhead box transcription factor L2 activates Fcp3C to regulate insect chorion formation.Open Biol. 2017 Jun;7(6):170061. doi: 10.1098/rsob.170061. Open Biol. 2017. PMID: 28615473 Free PMC article.
-
Characterization of the juvenile hormone pathway in the viviparous cockroach, Diploptera punctata.PLoS One. 2015 Feb 23;10(2):e0117291. doi: 10.1371/journal.pone.0117291. eCollection 2015. PLoS One. 2015. PMID: 25706877 Free PMC article.
-
Selection and assessment of reference genes for quantitative PCR normalization in migratory locust Locusta migratoria (Orthoptera: Acrididae).PLoS One. 2014 Jun 2;9(6):e98164. doi: 10.1371/journal.pone.0098164. eCollection 2014. PLoS One. 2014. PMID: 24887329 Free PMC article.
References
-
- Lohmann S, Herold A, Bergauer T, Belousov A, Betzl G, Demario M, Dietrich M, Luistro L, Poignee-Heger M, Schostack K. et al.Gene expression analysis in biomarker research and early drug development using function tested reverse transcription quantitative real-time PCR assays. Methods. 2012;59:10–19. - PubMed
-
- Andersen CL, Jensen JL, Orntoft TF. Normalization of real-time quantitative reverse transcription-PCR data: a model-based variance estimation approach to identify genes suited for normalization, applied to bladder and colon cancer data sets. Cancer Res. 2004;64:5245–5250. doi: 10.1158/0008-5472.CAN-04-0496. - DOI - PubMed
Publication types
MeSH terms
Substances
LinkOut - more resources
Full Text Sources
Other Literature Sources
Research Materials
Miscellaneous

