

Intrinsic atopic dermatitis shows similar TH2 and higher TH17 immune activation compared with extrinsic atopic dermatitis
- PMID: 23777851
- PMCID: PMC3991240
- DOI: 10.1016/j.jaci.2013.04.046
Intrinsic atopic dermatitis shows similar TH2 and higher TH17 immune activation compared with extrinsic atopic dermatitis
Abstract
Background: Atopic dermatitis (AD) is classified as extrinsic and intrinsic, representing approximately 80% and 20% of patients with the disease, respectively. Although sharing a similar clinical phenotype, only extrinsic AD is characterized by high serum IgE levels. Because most patients with AD exhibit high IgE levels, an "allergic"/IgE-mediated disease pathogenesis was hypothesized. However, current models associate AD with T-cell activation, particularly TH2/TH22 polarization, and epidermal barrier defects.
Objective: We sought to define whether both variants share a common pathogenesis.
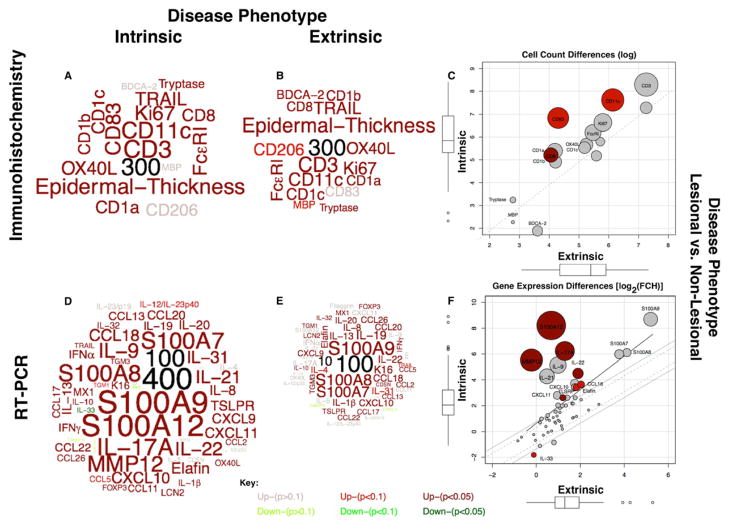
Methods: We stratified 51 patients with severe AD into extrinsic AD (n = 42) and intrinsic AD (n = 9) groups (with similar mean disease activity/SCORAD scores) and analyzed the molecular and cellular skin pathology of lesional and nonlesional intrinsic AD and extrinsic AD by using gene expression (real-time PCR) and immunohistochemistry.
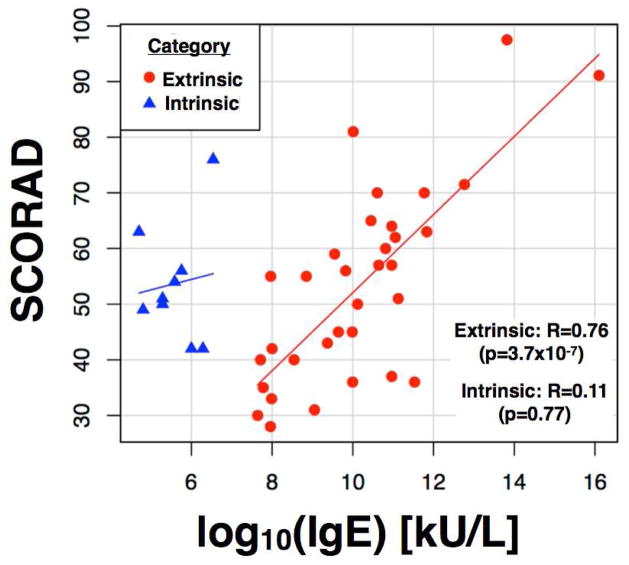
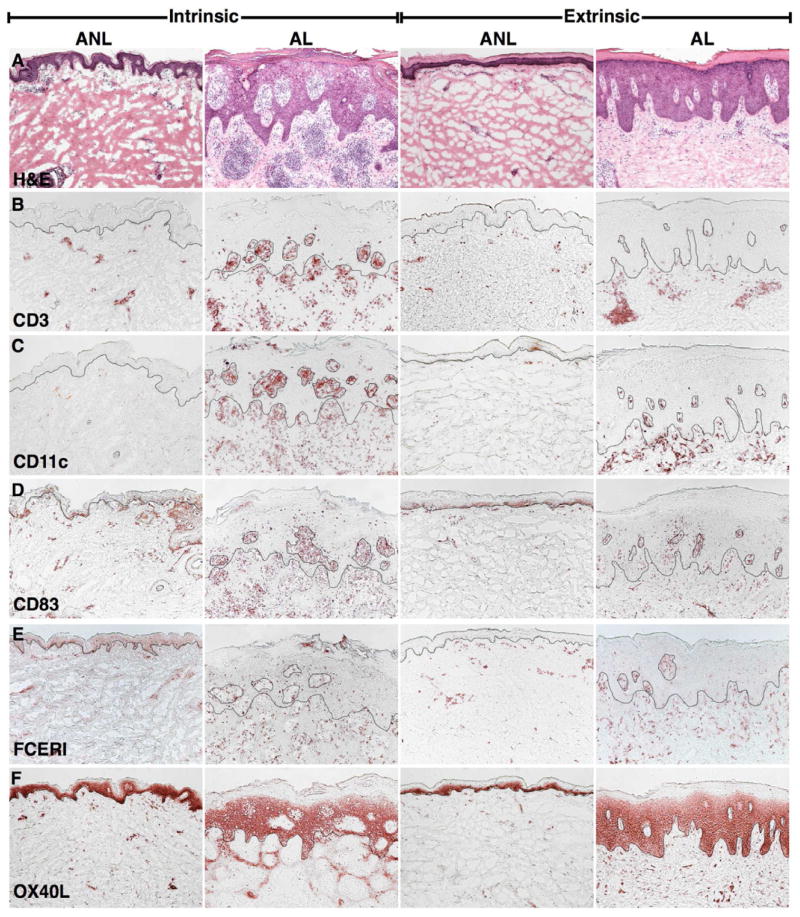
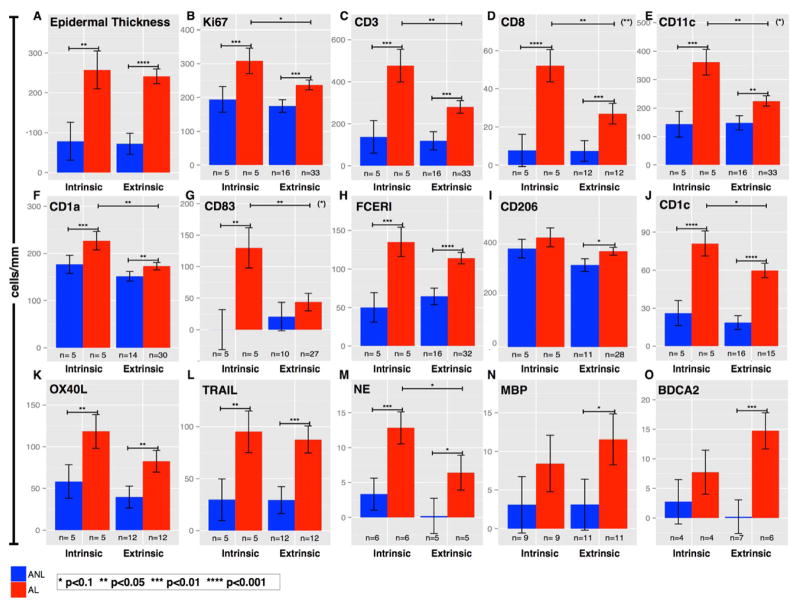
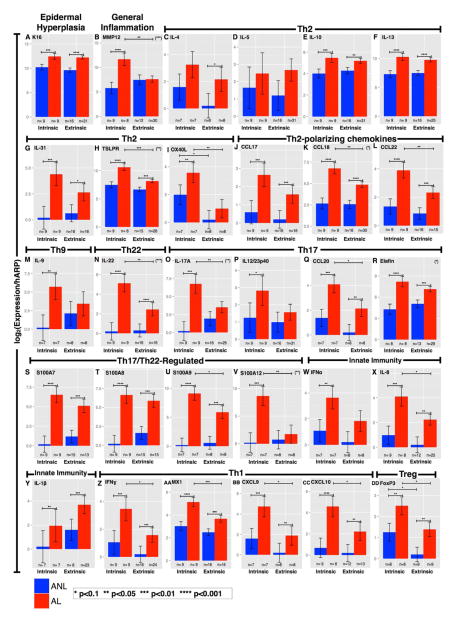
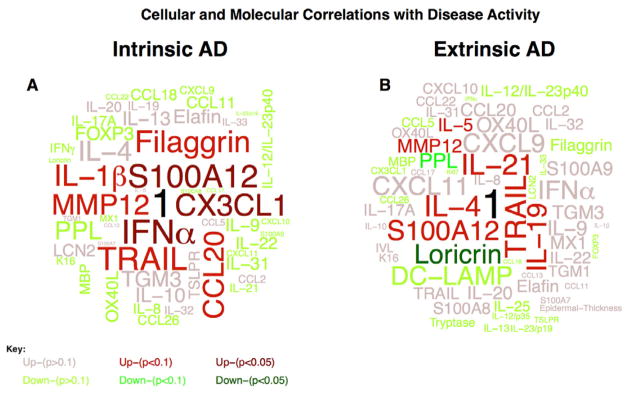
Results: A significant correlation between IgE levels and SCORAD scores (r = 0.76, P < 10(-5)) was found only in patients with extrinsic AD. Marked infiltrates of T cells and dendritic cells and corresponding epidermal alterations (keratin 16, Mki67, and S100A7/A8/A9) defined lesional skin of patients with both variants. However, higher activation of all inflammatory axes (including TH2) was detected in patients with intrinsic AD, particularly TH17 and TH22 cytokines. Positive correlations between TH17-related molecules and SCORAD scores were only found in patients with intrinsic AD, whereas only patients with extrinsic AD showed positive correlations between SCORAD scores and TH2 cytokine (IL-4 and IL-5) levels and negative correlations with differentiation products (loricrin and periplakin).
Conclusions: Although differences in TH17 and TH22 activation exist between patients with intrinsic AD and those with extrinsic AD, we identified common disease-defining features of T-cell activation, production of polarized cytokines, and keratinocyte responses to immune products. Our data indicate that a TH2 bias is not the sole cause of high IgE levels in patients with extrinsic AD, with important implications for similar therapeutic interventions.
Keywords: AD; Atopic dermatitis; DC; Dendritic cell; FLG; FOXP3; Filaggrin; Forkhead box protein 3; IHC; IgE; Immunohistochemistry; OX40 ligand; OX40L; RT-PCR; Real-time PCR; S100 proteins; TNF ligand superfamily 10; TRAIL; T cell; eczema; extrinsic; human skin; intrinsic; keratinocytes.
Copyright © 2013 American Academy of Allergy, Asthma & Immunology. Published by Mosby, Inc. All rights reserved.
Conflict of interest statement
Figures
References
-
- Guttman-Yassky E, Nograles K, Krueger JG. Contrasting pathogenesis of atopic dermatitis and psoriasis—Part I: Clinical and pathologic concepts. J Allergy Clin Immunol. 2011;127:1110–8. - PubMed
-
- Akdis CA, Akdis M. Immunological differences between intrinsic and extrinsic types of atopic dermatitis. Clin Exp Allergy. 2003 Dec;33(12):1618–21. - PubMed
-
- Schmid-Grendelmeier P, Simon D, Simon HU, Akdis CA, Wüthrich B. Epidemiology, clinical features, and immunology of the “intrinsic” (non-IgEmediated) type of atopic dermatitis (constitutional dermatitis) Allergy. 2001 Sep;56(9):841–9. - PubMed
-
- Jeong CW, Ahn KS, Rho N-K, Park YD, Lee D-Y, Lee J-H, et al. Differential in vivo cytokine mRNA expression in lesional skin of intrinsic vs. extrinsic atopic dermatitis patients using semiquantitative RT-PCR. Clin Exp Allergy. 2003 Dec;33(12):1717–24. - PubMed
-
- Simon HU, Blaser K. Inhibition of programmed eosinophil death: a key pathogenic event for eosinophilia? Immunol Today. 1995 Feb;16(2):53–5. - PubMed
Publication types
MeSH terms
Substances
Grants and funding
LinkOut - more resources
Full Text Sources
Other Literature Sources
Research Materials
Miscellaneous
