. 2013 Jul;123(7):3146-53.
doi: 10.1172/JCI67638. Epub 2013 Jun 17.

iPSC-derived β cells model diabetes due to glucokinase deficiency

Affiliations

iPSC-derived β cells model diabetes due to glucokinase deficiency

Haiqing Hua et al. J Clin Invest. 2013 Jul.

Retraction in

  • iPSC-derived β cells model diabetes due to glucokinase deficiency.
    Hua H, Shang L, Martinez H, Freeby M, Gallagher MP, Ludwig T, Deng L, Greenberg E, LeDuc C, Chung WK, Goland R, Leibel RL, Egli D. Hua H, et al. J Clin Invest. 2017 Mar 1;127(3):1115. doi: 10.1172/JCI92775. Epub 2017 Jan 17. J Clin Invest. 2017. PMID: 28094769 Free PMC article. No abstract available.

Abstract

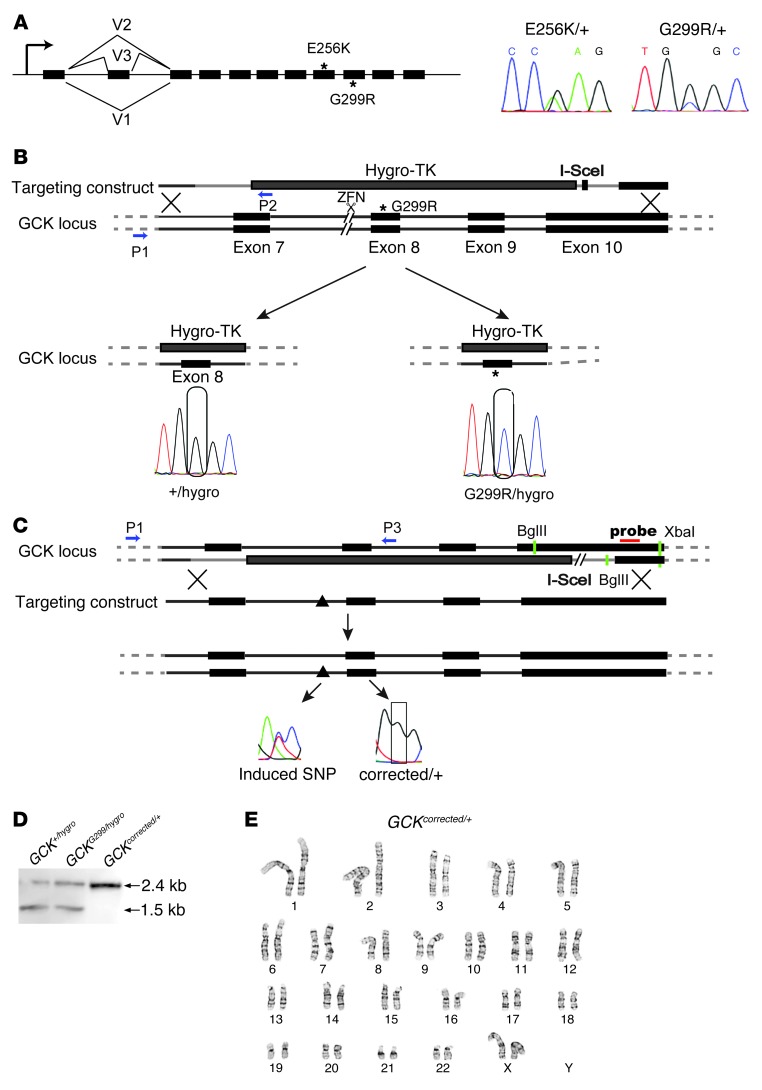
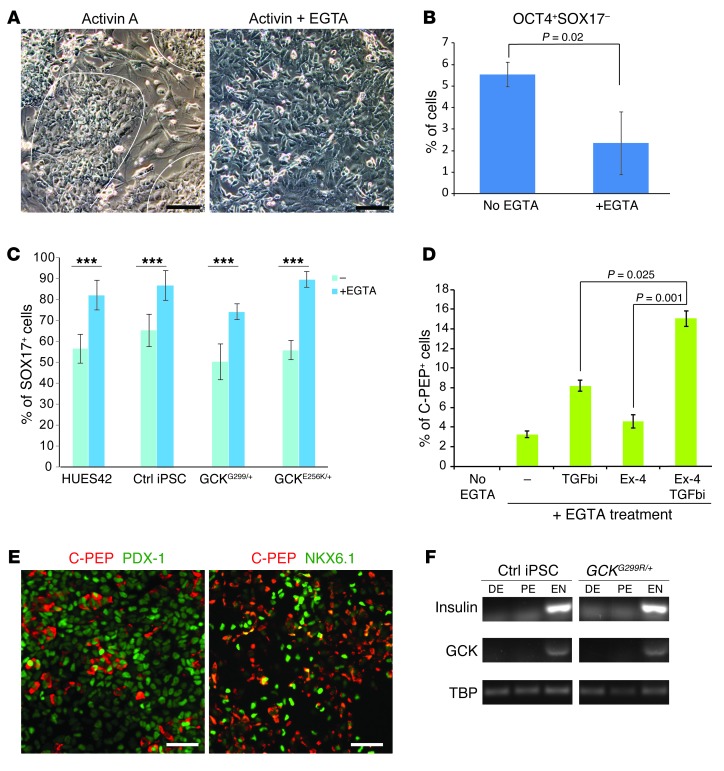
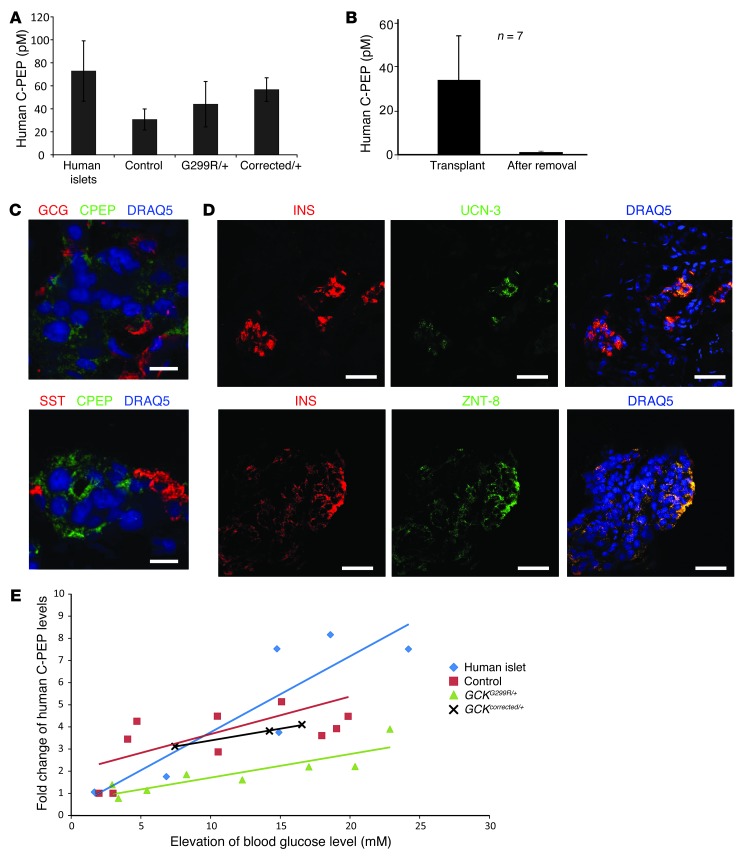
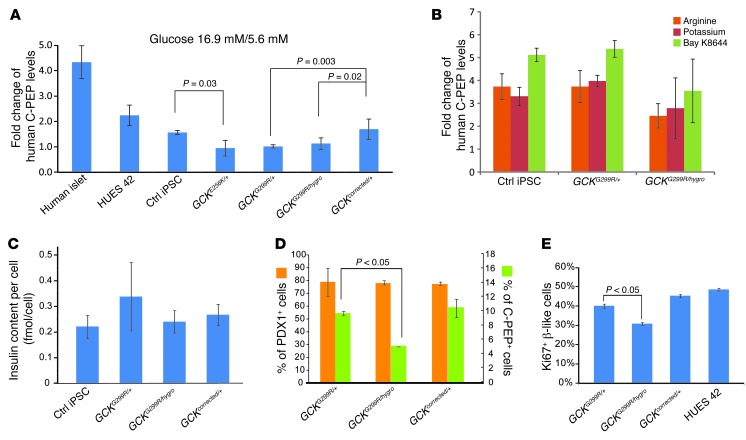
Diabetes is a disorder characterized by loss of β cell mass and/or β cell function, leading to deficiency of insulin relative to metabolic need. To determine whether stem cell-derived β cells recapitulate molecular-physiological phenotypes of a diabetic subject, we generated induced pluripotent stem cells (iPSCs) from subjects with maturity-onset diabetes of the young type 2 (MODY2), which is characterized by heterozygous loss of function of the gene encoding glucokinase (GCK). These stem cells differentiated into β cells with efficiency comparable to that of controls and expressed markers of mature β cells, including urocortin-3 and zinc transporter 8, upon transplantation into mice. While insulin secretion in response to arginine or other secretagogues was identical to that in cells from healthy controls, GCK mutant β cells required higher glucose levels to stimulate insulin secretion. Importantly, this glucose-specific phenotype was fully reverted upon gene sequence correction by homologous recombination. Our results demonstrate that iPSC-derived β cells reflect β cell-autonomous phenotypes of MODY2 subjects, providing a platform for mechanistic analysis of specific genotypes on β cell function.


Figures

Figure 1
Figure 1. An allelic series of GCK mutations in cells from a MODY2 subject.
(A) Structure of the GCK gene and nucleotide sequences of the mutations. Black boxes represent exons. The asterisks indicate the mutations (E256K and G299R). (B) Schematic view of the first step of the gene correction procedure: exons 7–10 of GCK, either the mutant or the wild-type allele, were replaced with a hygro-TK cassette. Sequences at the mutation site were analyzed by Sanger sequencing. P1 and P2 (blue arrows) were the primers used to detect integration of the hygro-TK (see Supplemental Table 2 for primer sequences). (C) Scheme of the second round of gene targeting replacing the hygro-TK cassette with the wild-type locus marked by an intronic SNP (triangle). Both targeting steps were facilitated by site-specific endonucleases, a ZFN for the first step and I-SceI for the second step. Green bars indicate the restriction sites, and the red bar indicates the probe used for Southern blot analysis. Blue bars represent primers used to screen and identify targeting events (see Supplemental Table 2 for primer sequences). PCR (with P1 and P3) and Sanger sequencing showed the corrected sequence at the mutation site and the intronic SNP that marks the corrected allele. (D) Southern blot analysis showing 2 bands representing the targeted allele (GCK+/hygro, 1.5 kb) and the nontargeted allele (GCK+/hygro or GCKG299R/hygro, 2.4 kb). (E) Karyotype analysis of GCKcorrected/+ cells.
Figure 2
Figure 2. Enhanced β cell generation through calcium chelation and TGF-β signaling inhibition.
(A) Morphology of control iPSCs after 1 day of activin A treatment with and without EGTA. Boundaries of colonies are indicated by white lines. Scale bar: 50 μm. (B and C) Differentiation of control iPSCs in the presence or absence of EGTA. Quantification of (B) OCT4-positive SOX17-negative cells and (C) SOX17-positive cells after 3 days of differentiating control iPSCs. ***P < 0.001. (D) Percentage of insulin-positive cells (stained for C-peptide [C-PEP]) after treatment for 2 days with the indicated compounds (n = 8 replicas). (E) Immunostaining of β cells derived in vitro (day 14). Scale bar: 50 μm. (F) The mRNA expression of INS and GCK at definitive endoderm (DE), pancreatic endoderm (PE), and endocrine (EN) stages of differentiation, determined by semiquantitative RT-PCR. TBP, TATA box binding protein. All error bars in this figure represent SEM.
Figure 3
Figure 3. β Cells derived in vivo display characteristics of mature β cells.
(A) Human C-peptide concentrations in mouse sera collected in the fasting state. Error bars represent standard deviation. (B) Measurement of human C-peptide levels in mouse sera prior to and after excision of the transplants. Mice transplanted with GCK mutant cells (GCKG299R/+) are shown. Error bars represent standard deviation. (C and D) Immunohistochemistry of explants isolated 4 months after transplantation of GCK mutant cells (GCKG299R/+). GCG, glucagon; SST, somatostatin; INS, insulin; UCN-3, urocortin-3; ZNT8, zinc transporter 8. Scale bar: 10 μm (C); 100 μm (D). (E) Scatter plots showing fold change in C-peptide concentration (30 minutes after glucose injection versus 16 hours of fasting) versus the change in capillary blood glucose concentration (30 minutes after glucose injection minus 16 hours of fasting) during intraperitoneal glucose tolerance tests.
Figure 4
Figure 4. GCK gene dosage specifically affects glucose-stimulated insulin secretion.
(A) Fold change of glucose-stimulated insulin (C-peptide) secretion in human islets and control, GCK mutant, and gene-corrected cells in vitro. The basal condition was 5.6 mM glucose, and the stimulation condition was 16.9 mM glucose. Error bars represent standard deviation of 3 experiments. (B) Insulin (C-peptide) secretion in response to indicated secretagogues in vitro. (C) Insulin content of control cells and GCK mutant and gene-corrected cells calculated with total insulin content and numbers of insulin-positive cells. (D) Differentiation efficiency of GCK G299R mutant and gene-corrected cells. (BD) Error bars represent standard deviation. (E) Proportion of in vitro–differentiated β cells (C-peptide positive) that were Ki67 positive. Error bars represent SEM (n = 20 replicates).

References

    1. Park IH, et al. Disease-specific induced pluripotent stem cells. Cell. 2008;134(5):877–886. doi: 10.1016/j.cell.2008.07.041. - DOI - PMC - PubMed
    1. Maehr R, et al. Generation of pluripotent stem cells from patients with type 1 diabetes. Proc Natl Acad Sci U S A. 2009;106(37):15768–15773. doi: 10.1073/pnas.0906894106. - DOI - PMC - PubMed
    1. Kroon E, et al. Pancreatic endoderm derived from human embryonic stem cells generates glucose-responsive insulin-secreting cells in vivo. Nat Biotechnol. 2008;26(4):443–452. doi: 10.1038/nbt1393. - DOI - PubMed
    1. Ohmine S, et al. Reprogrammed keratinocytes from elderly type 2 diabetes patients suppress senescence genes to acquire induced pluripotency. Aging (Albany NY). 2012;4(1):60–73. - PMC - PubMed
    1. Teo AK, et al. Derivation of human induced pluripotent stem cells from patients with maturity onset diabetes of the young. J Biol Chem. 2013;288(8):5353–5356. doi: 10.1074/jbc.C112.428979. - DOI - PMC - PubMed

Publication types

MeSH terms

Supplementary concepts