. 2013 Jul;123(7):2873-92.
doi: 10.1172/JCI67428. Epub 2013 Jun 17.

CD4⁺ follicular helper T cell infiltration predicts breast cancer survival

Affiliations

CD4⁺ follicular helper T cell infiltration predicts breast cancer survival

Chunyan Gu-Trantien et al. J Clin Invest. 2013 Jul.

Abstract

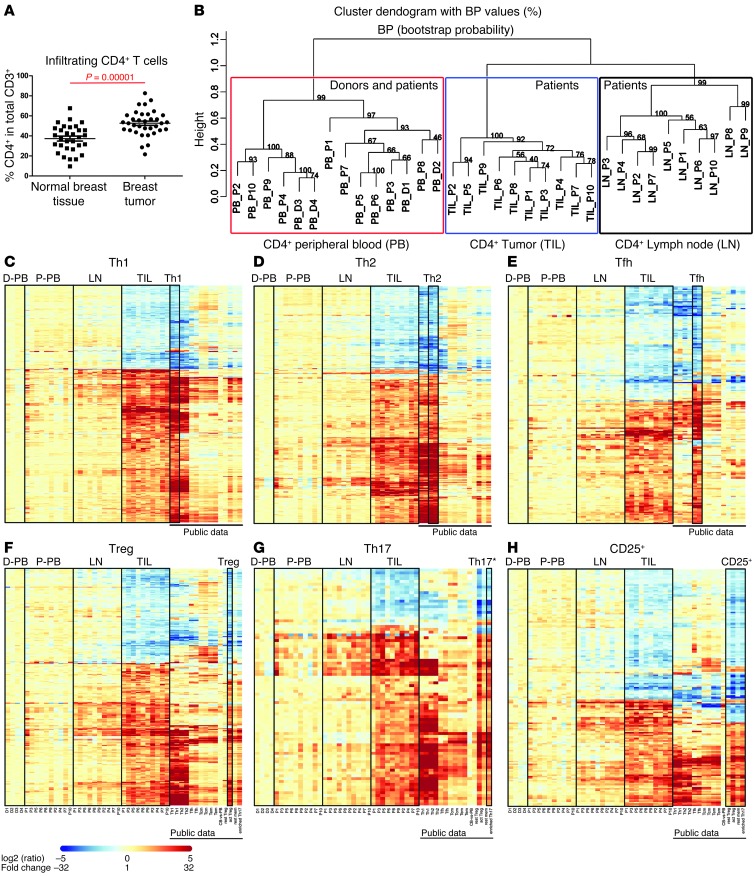
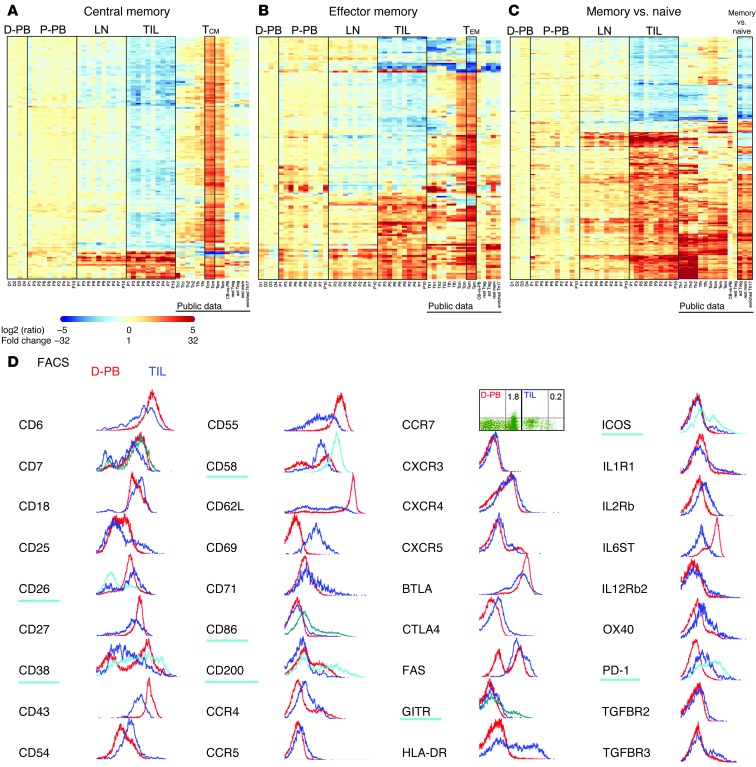
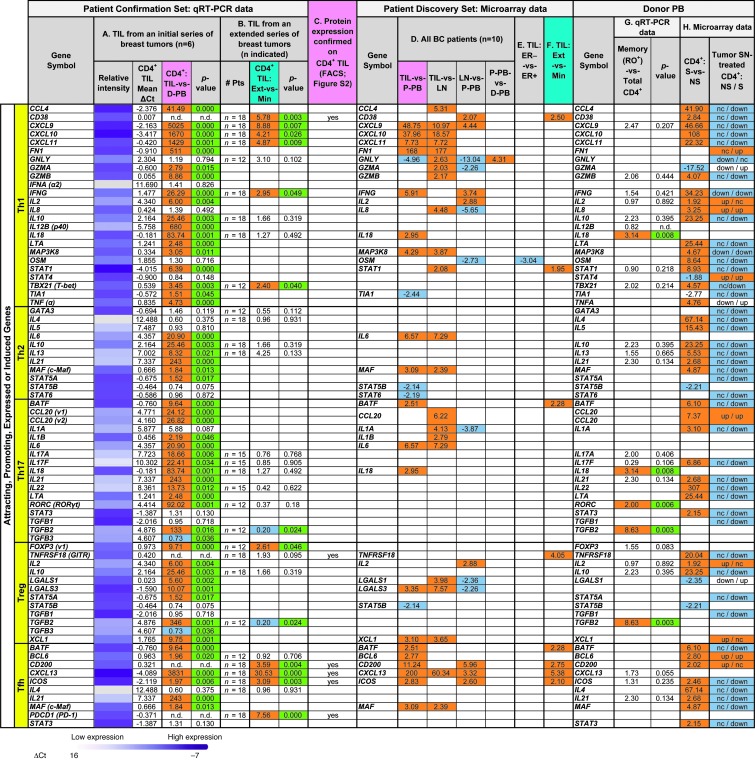
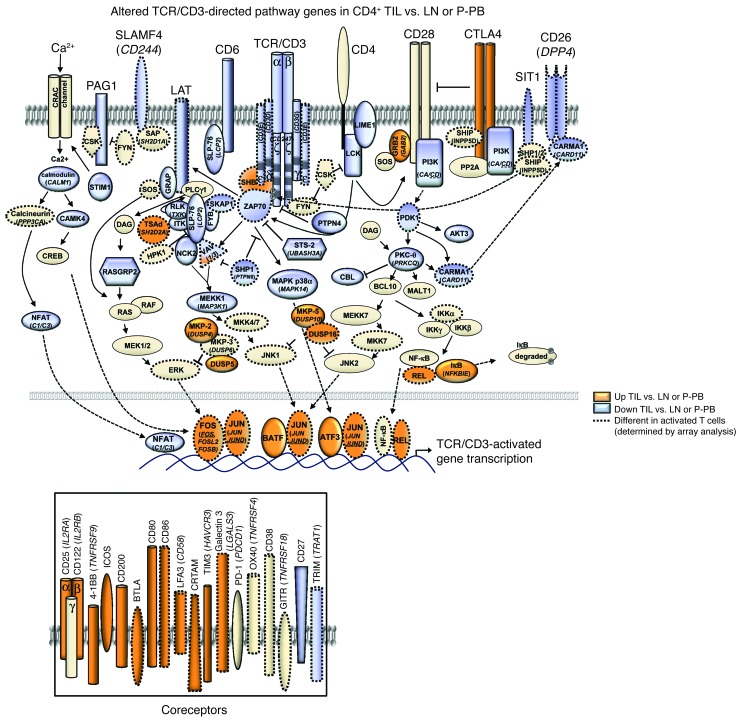
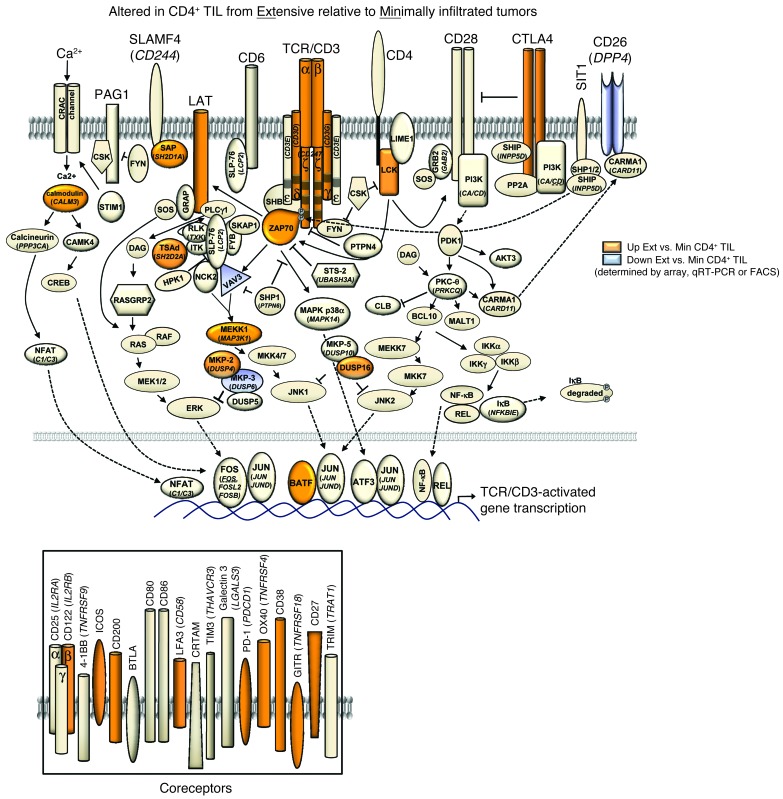
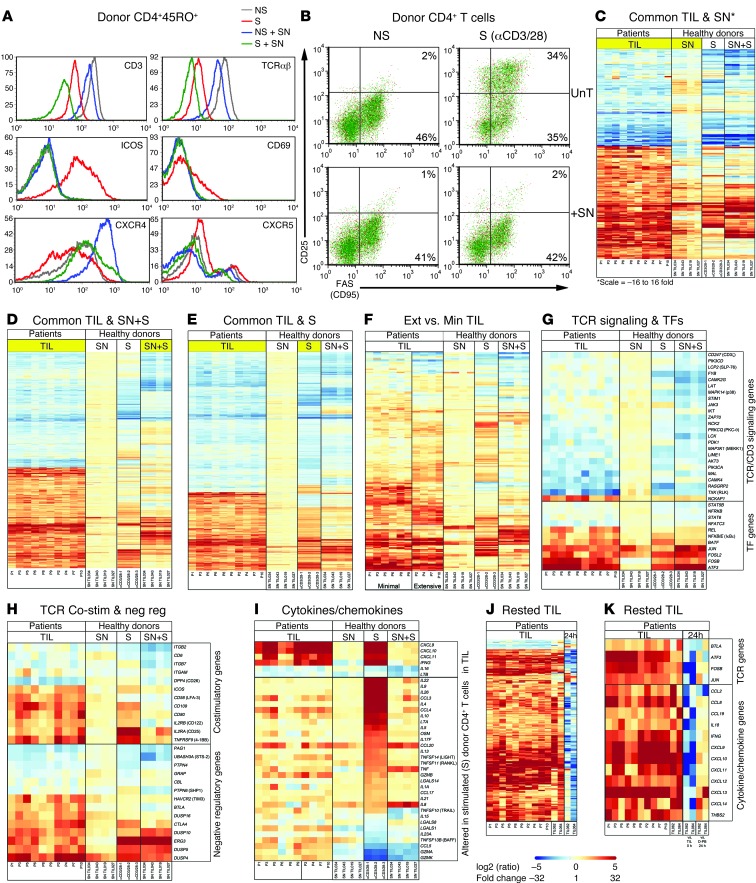
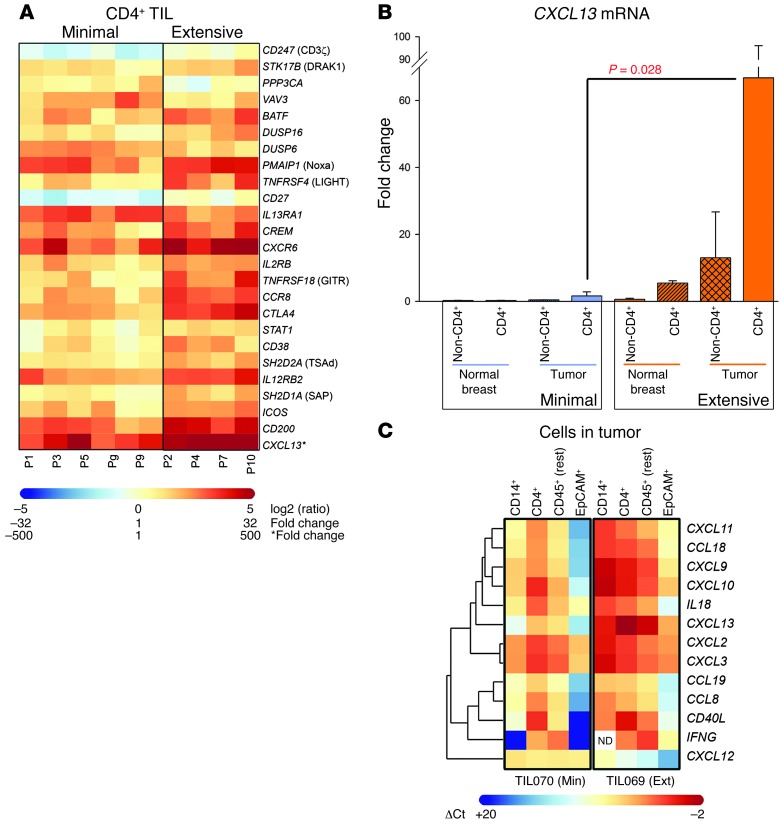
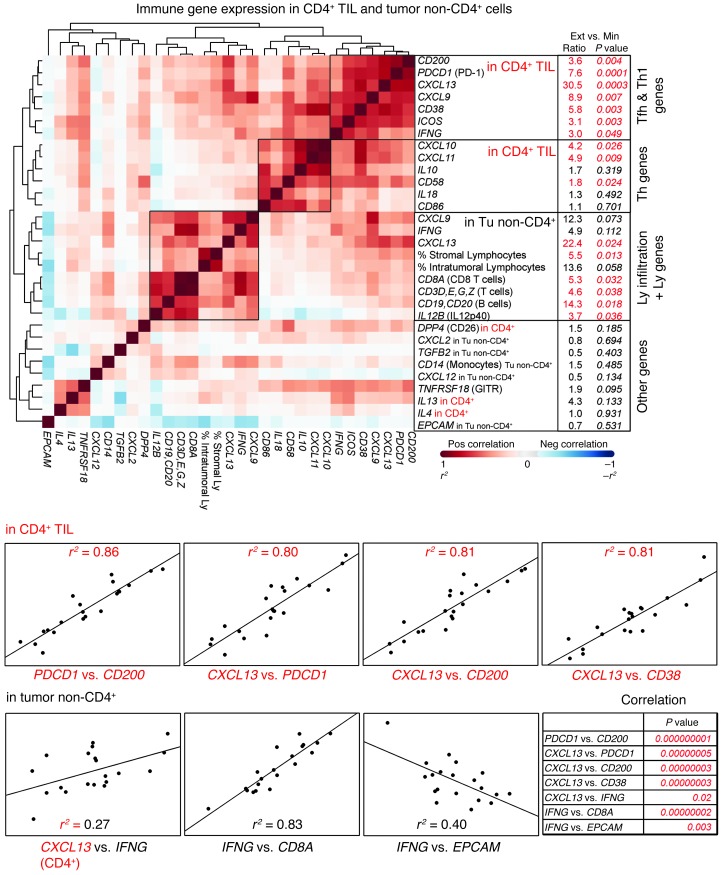
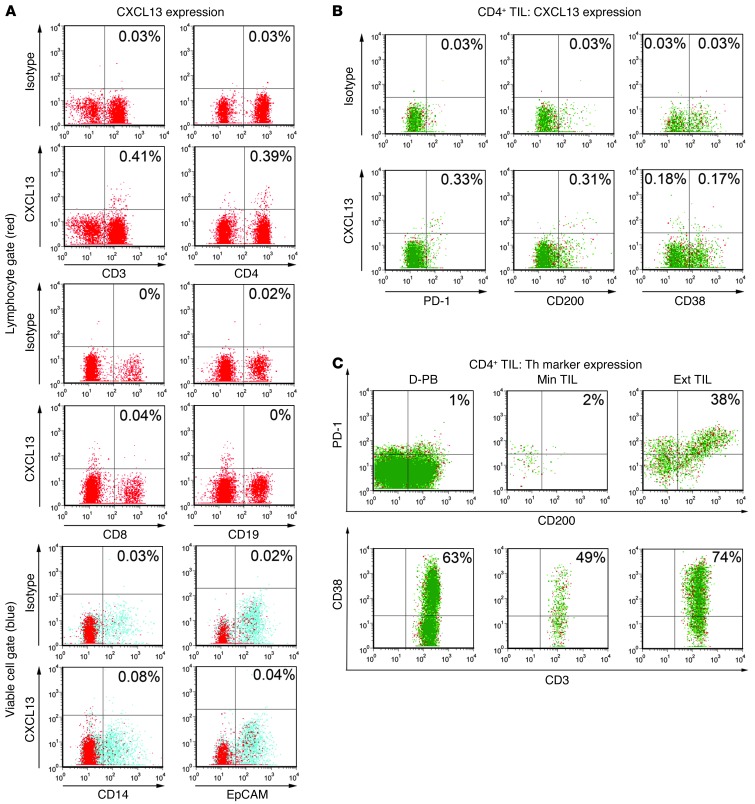
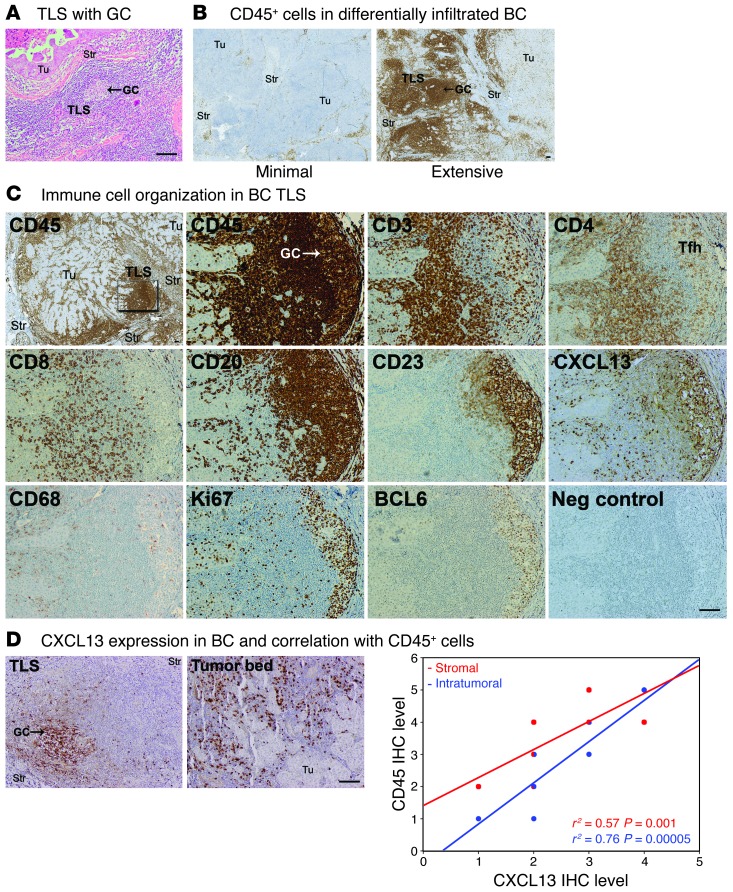
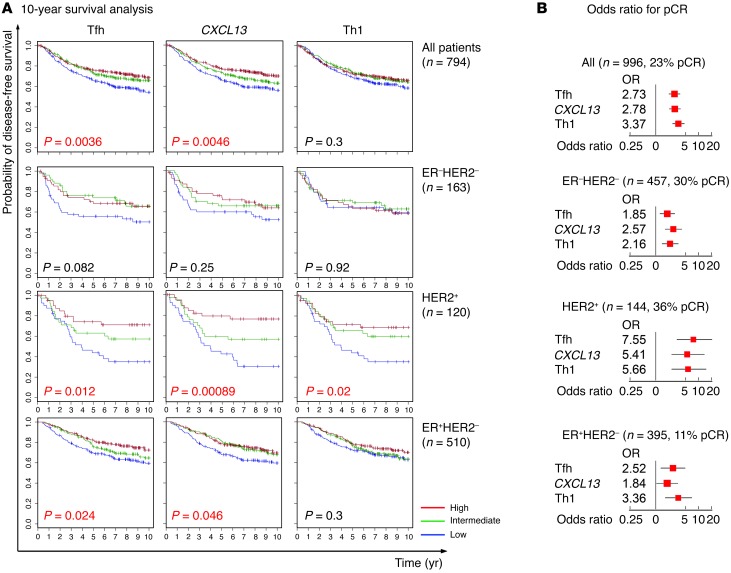
CD4⁺ T cells are critical regulators of immune responses, but their functional role in human breast cancer is relatively unknown. The goal of this study was to produce an image of CD4⁺ T cells infiltrating breast tumors using limited ex vivo manipulation to better understand the in vivo differences associated with patient prognosis. We performed comprehensive molecular profiling of infiltrating CD4⁺ T cells isolated from untreated invasive primary tumors and found that the infiltrating T cell subpopulations included follicular helper T (Tfh) cells, which have not previously been found in solid tumors, as well as Th1, Th2, and Th17 effector memory cells and Tregs. T cell signaling pathway alterations included a mixture of activation and suppression characterized by restricted cytokine/chemokine production, which inversely paralleled lymphoid infiltration levels and could be reproduced in activated donor CD4⁺ T cells treated with primary tumor supernatant. A comparison of extensively versus minimally infiltrated tumors showed that CXCL13-producing CD4⁺ Tfh cells distinguish extensive immune infiltrates, principally located in tertiary lymphoid structure germinal centers. An 8-gene Tfh signature, signifying organized antitumor immunity, robustly predicted survival or preoperative response to chemotherapy. Our identification of CD4⁺ Tfh cells in breast cancer suggests that they are an important immune element whose presence in the tumor is a prognostic factor.


Figures

Figure 1
Figure 1. Characteristics of CD4+ T cells infiltrating breast tumors.
(A) The percentage of CD4+ within the CD3+ subpopulation was determined by flow cytometry (see Supplemental Figure 1). (BH) Purified CD4+ T cells were from fresh tumor homogenates (TIL), LNs, P-PB, or D-PB (patient discovery set; Supplemental Table 1B). (B) Dendrogram of unsupervised hierarchical clustering analysis generated with pvclust using the top 5% (n = 2,734) most variable probe sets across all samples. Robustness was estimated by bootstrap analysis with the corresponding probability values (BP) shown. (CH) Statistically significant gene changes established for the comparison of TIL versus P-PB (Supplemental Table 2B) were compared with public microarray data sets of human Th subpopulations that we reanalyzed (Supplemental Methods) to determine preferentially altered Th subset genes (Supplemental Table 3). Individual heat maps (red, upregulated; blue, downregulated) show genes altered in both the TIL and the indicated Th subset. Samples include our data (normalized to D1–D4 PB), D-PB (n = 4), P-PB (n = 10), LN (n = 10), TIL (n = 10), and public microarray data (normalized to naive cells in the same data set), Th1 (n = 2), Th2 (n = 2), Tfh (n = 2), central memory T cells (TCM) (n = 2), effector memory T cells (TEM) (n = 2), cord blood versus PB (n = 1), resting Tregs (n = 1), activated Tregs (n = 1), resting memory cells (n = 1), and a population enriched in Th17 (n = 1).
Figure 2
Figure 2. Characteristics of CD4+ T cells infiltrating breast tumors.
Purified CD4+ T cells were from fresh tumor homogenates, LNs, P-PB, or D-PB (patient discovery set; Supplemental Table 1B). (AC) Statistically significant gene changes established for the comparison of TIL versus P-PB (Supplemental Table 2B) were compared with public microarray data sets of human Th subpopulations that we reanalyzed (Supplemental Methods) as in Figure 1, C–H. (D) Histogram or dot plot thumbnails for 36 Th surface markers (genes in AC and Figure 1, C–H; complete profiles plus 24 additional markers in Supplemental Figure 2) expressed on CD4+ TIL (variation is indicated by shades of blue) and D-PB (red). The genes underlined in aqua were also analyzed by qRT-PCR on a larger patient group (Figure 8).
Figure 3
Figure 3. Conventional Th subset marker expression in TIL.
(AC) Th subset marker genes were quantified in the patient confirmation set by (A and B) qRT-PCR and (C) flow cytometry. (A) Mean ΔCt values (relative to the Th-specific endogen CASC3) are inversely proportional to the relative intensity of gene expression; CD4+ TIL (n = 6) are compared with D-PB (n = 6). (B) CD4+ TIL from extensively infiltrated tumors (n = 6) are compared with minimally infiltrated tumors (n = 12). “n = <18” indicates that the number of minimally infiltrated tumors assessed was as noted. (C) Protein expression was assessed by flow cytometry (Supplemental Figure 2). (DF) Microarray data from the patient discovery set and (G) qRT-pCR data of memory versus total CD4+ T cells from healthy donor cells are shown for comparison with (D) CD4+ T cells isolated from the first tissue (i.e., TIL) relative to the second tissue (i.e., P-PB), (E) CD4+ T cells isolated from ER relative to ER+ tumors, (F) CD4+ T cells isolated from extensively infiltrated tumors relative to minimally infiltrated tumors, and (G) D-PB CD4+CD45RO+ memory T cells (n = 3) compared with total CD4+ T cells (n = 3). (H) Microarray data of D-PB memory CD4+ T cells after S or tumor SN treatment (Figure 6 and Supplemental Table 6). Fold change or ratio values are shown as blue (downregulated) and orange (upregulated); P values (2-tailed Student’s t test with unequal variance) in green are significant (P < 0.05); n.d., not determined (for qRT-PCR data no data = n.d.); nc, no change (for microarray data empty cells = nc). For gene symbols, “v” indicates transcript variant.
Figure 4
Figure 4. TCR/CD3 pathway gene expression in CD4+ TIL.
Schematic representation of TCR/CD3 pathway and coreceptor gene expression derived from microarray (Supplemental Table 2, B and C), qRT-PCR (Supplemental Table 5B), and flow cytometry (Supplemental Figure 2) data, with individual genes detailed in Supplemental Table 4. Gene expression changes in the TIL versus P-PB and/or TIL versus LN data comparisons are shown (blue, downregulated; orange, upregulated).
Figure 5
Figure 5. TCR/CD3 pathway gene expression in CD4+ TIL.
Schematic representation of TCR/CD3 pathway and coreceptor gene expression derived as in Figure 4. Genes altered in extensively (Ext) compared with minimally (Min) infiltrated tumors are shown.
Figure 6
Figure 6. Tumor SN suppresses activation of donor CD4+ T cells.
D-PB CD4+ T cells (unstimulated or S) were treated for 24 hours with primary tumor SN. Expression of activation markers on (A) CD4+CD45RO+ T cells or (B) total CD4+ T cells. (CI) TIL gene expression data (P1–P10) was compared with donor CD4+CD45RO+ T cells treated with SN with or without S (SN = 2 minimal [TIL034 and TIL043] and 2 extensive [TIL019 and TIL027; the latter is borderline extensive, Supplemental Table 1C] tumors; Supplemental Table 1C). Heat maps show genes commonly altered in TIL and donor cells treated with SN with or without S for the designated comparison (red, upregulated; blue, downregulated). Samples include TIL from minimally (P1, P3, P5, P6, P8, P9) and extensively (P2, P4, P7, P10) infiltrated tumors; SN-treated (n = 4), S-treated (n = 3), and SN+S-treated (n = 4) D-PB. Genes commonly altered in P1–P10 TIL versus their P-PB and (C) SN-treated, (D) SN+S-treated, or (E) S-treated donor cells are highlighted. (F) Genes differentially expressed in TIL from extensively versus minimally infiltrated tumors and altered by SN or S+SN treatment are highlighted. Select TCR/CD3 pathway genes include (G) signaling molecules and targeted transcription factors; (H) costimulatory receptors and negative regulatory genes; and (I) cytokine/chemokine genes. (J and K) Freshly isolated CD4+ TIL from patients (TIL062 and TIL064; Supplemental Table 1C) and CD4+ memory T cells from D-PB were immediately extracted or rested for 24 hours. Specific gene changes in the two rested TIL were compared with P1–P10 TIL. Expression levels for the commonly altered genes are shown in J, with specific TCR/CD3 pathway and cytokine/chemokine genes highlighted in K.
Figure 7
Figure 7. Genes predominately expressed in CD4+ TIL from extensively and minimally infiltrated tumors.
(A) Heat map (red, upregulated; blue, downregulated) for a select group of differentially expressed genes in extensively compared with minimally infiltrated tumors (P1–P10 TIL; Supplemental Table 2G), including TCR/CD3 pathway, activation-induced, and conventional Th subset marker genes. Due to its high expression levels, the scale for CXCL13 is different. (B) CXCL13 transcript levels determined by qRT-PCR (normalized to TMBIM4 [endogen]) in either CD4+ or non-CD4 cells (remaining cells in CD4-depleted homogenates) from tumors and normal breast tissue (n = 6; 3 extensive [orange], 3 minimal [blue]; fold changes were normalized to the 3 minimal CD4+ cells). P values were calculated for several comparisons (Supplemental Table 5E), with the P value for CD4+ TIL (Ext vs. Min) shown (mean ± SEM). (C) CD14+ (monocyte), CD4+, remaining CD45+ (other leukocytes), and EpCAM+ cells (epithelial marker on breast tumor cells) were isolated from a minimally (TIL070) and an extensively infiltrated (TIL069) tumor. Expression of select cytokine/chemokine genes analyzed by qRT-PCR (red, high expression/low ΔCt; blue, low expression/high ΔCt; normalized to SDHA, TBP, and TMBIM4 as endogens).
Figure 8
Figure 8. Correlation among the expression of Tfh marker genes, a Th1 immune profile, and the extent of lymphocyte infiltration.
qRT-PCR ΔCt values for immune genes expressed in CD4+ TIL (normalized to the Th-specific endogen CASC3) or non-CD4 cells (normalized to the 3 endogens in Figure 7C) from 21 tumors were used to generate unsupervised hierarchical clustering. The immune genes include differentially expressed CD4+ TIL surface receptors (Figure 2D) and cytokine/chemokine genes elevated in extensively infiltrated TIL (Figure 3). In the non-CD4 cells, expression of major immune subpopulation markers and cytokines associated with Th1 (IL12), Th2 (IL4 and IL13), immune suppression (IL10 and TGFB2), tumor promotion (CXCL2 and CXCL12), and the tumor marker EPCAM were analyzed. Pearson correlation coefficients (r2) were calculated for individual gene combinations or with lymphocyte infiltration levels (Supplemental Table 5D). A negative correlation (–r2 = –1) is shown in blue and a positive correlation (r2 = 1) is shown in red. Fold change (ratio) and P values for extensively (n = 6) versus minimally (n = 12) infiltrated tumors are indicated (significant values are shown in red; P < 0.05). Additionally, select correlation plots are shown for relevant surface marker and CXCL13 gene expression in CD4+ TIL (red) and non-CD4+ cells (black) (significant values are shown in red; P < 0.05).
Figure 9
Figure 9. Tfh TIL are the major producers of CXCL13 protein.
(A) Dot plots of intracellular CXCL13 protein expression in conjunction with subpopulation surface markers (total markers = 17; Supplemental Figure 3) in fresh tumor homogenates (unstimulated). Lymphocyte gate for total T cells (CD3), T cell subsets (CD4 and CD8), and B cells (CD19) or viable cell gate for monocytes (CD14) and epithelial/tumor cells (EpCAM). (B) Intracellular CXCL13 expression levels in CD4+ TIL associated with the CD200 and PD-1 (Tfh) or CD38 (Th1). (C) Tfh (CD200hi and PD-1hi) and Th1 (CD38hi) surface markers on D-PB and CD4+ TIL from an extensive and a minimally infiltrated tumor.
Figure 10
Figure 10. Organization of the immune infiltrate in extensively infiltrated breast tumors.
(A) TLS containing GC detected in H&E-stained primary tumor sections. Tu, tumor bed; Str, stroma. (B) CD45 (total leukocytes) IHC staining of an extensively and a minimally infiltrated tumor shown for comparison. (C) Successive paraffin-embedded tumor sections from 15 patients were stained by IHC for CD45 (total leukocytes); CD3 (total T cells); CD4 (helper T cells); CD8 (cytotoxic T cells); CD20 (B cells); CD23 (GC FDCs); CD68 (macrophages); Ki67 (dividing cells; 5 patients); Bcl6 (Tfh and GC B cells; 5 patients); and CXCL13 (Tfh and FDC marker). The boxed area in the first CD45 image is the area magnified in all of the following images of sequential sections labeled with leukocyte subpopulation markers. (D) CXCL13 IHC staining in tumor sections (LN control; Supplemental Figure 4) shows cytoplasmic expression in GC-localized cells and some lymphocytes infiltrating the tumor bed (but not in tumor cells). The intensity of CXCL13 staining was correlated with the extent of stromal (red) or intratumoral (blue) CD45+ infiltrates for 15 tumors. Scale bar: 100 mm.
Figure 11
Figure 11. An 8-gene Tfh signature strongly predicts positive clinical outcome in BC.
(A) Our Tfh (plus CXCL13 alone) and Th1 signatures were tested on public microarray data sets from 794 primary systemically untreated patients with BC for 10-year DFS (Supplemental Table 7). Kaplan-Meier survival curves were generated for the total patient population and 3 major BC subsets: ER/HER2, HER2+, and ER+/HER2; 1 patient was unclassified). Gene expression levels are defined as tertiles of the continuous signature scores: blue, low; green, intermediate; and red, high. P values in red are significant (P < 0.05). (B) Our Tfh (plus CXCL13 alone) and Th1 signatures were also tested on a group of 966 patients for predicting pCR to neoadjuvant chemotherapy (44). Forest plots show the odds ratios (ORs) for pCR in the total patient population and the indicated subtypes. The size of the square (P < 0.05 in red indicates a nominal significant effect) is inversely proportional to the standard error, with the horizontal bars representing the 95% CI of the odds ratio. Signature genes and additional data, including comparisons with published immune signatures, are in Supplemental Table 7.

Similar articles

Cited by

References

    1. Perou CM, et al. Molecular portraits of human breast tumours. Nature. 2000;406(6797):747–752. doi: 10.1038/35021093. - DOI - PubMed
    1. Sorlie T, et al. Gene expression patterns of breast carcinomas distinguish tumor subclasses with clinical implications. Proc Natl Acad Sci U S A. 2001;98(19):10869–10874. doi: 10.1073/pnas.191367098. - DOI - PMC - PubMed
    1. Sotiriou C, Pusztai L. Gene-expression signatures in breast cancer. N Engl J Med. 2009;360(8):790–800. doi: 10.1056/NEJMra0801289. - DOI - PubMed
    1. Sotiriou C, et al. Gene expression profiling in breast cancer: understanding the molecular basis of histologic grade to improve prognosis. J Natl Cancer Inst. 2006;98(4):262–272. doi: 10.1093/jnci/djj052. - DOI - PubMed
    1. Ascierto ML, et al. An immunologic portrait of cancer. J Transl Med. 2011;9:146. doi: 10.1186/1479-5876-9-146. - DOI - PMC - PubMed

Publication types

MeSH terms