. 2013 Jul;123(7):3002-13.
doi: 10.1172/JCI68996. Epub 2013 Jun 17.

Dysregulation of voltage-gated sodium channels by ubiquitin ligase NEDD4-2 in neuropathic pain

Affiliations

Dysregulation of voltage-gated sodium channels by ubiquitin ligase NEDD4-2 in neuropathic pain

Cédric J Laedermann et al. J Clin Invest. 2013 Jul.

Abstract

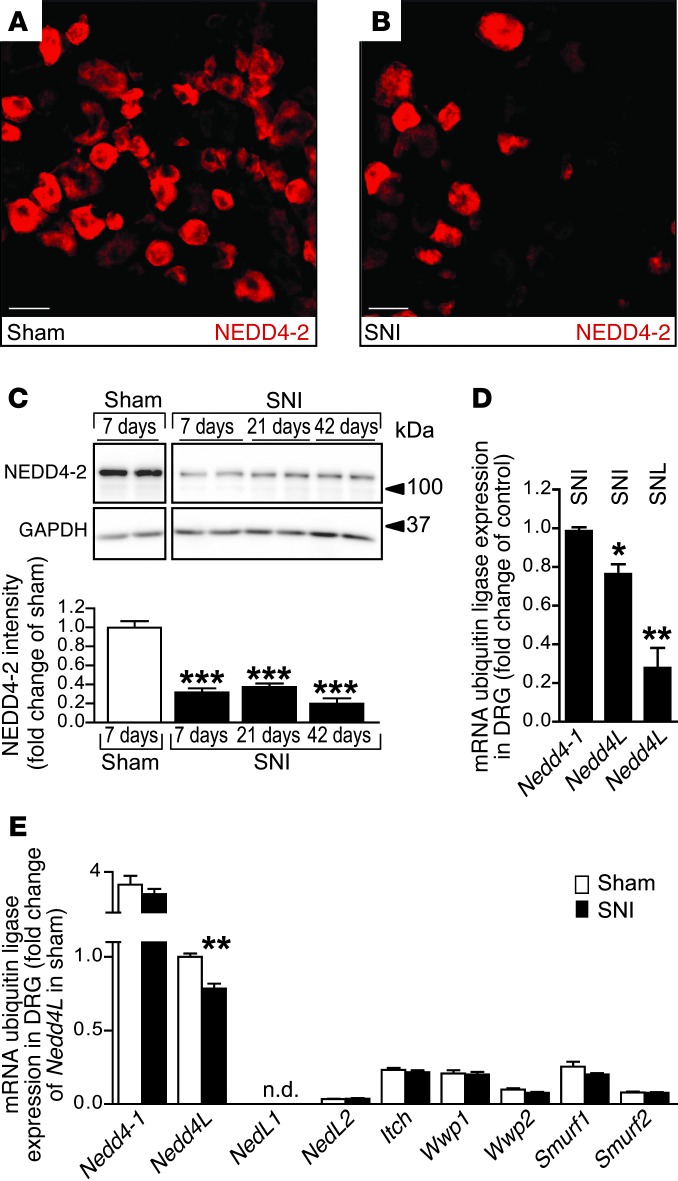
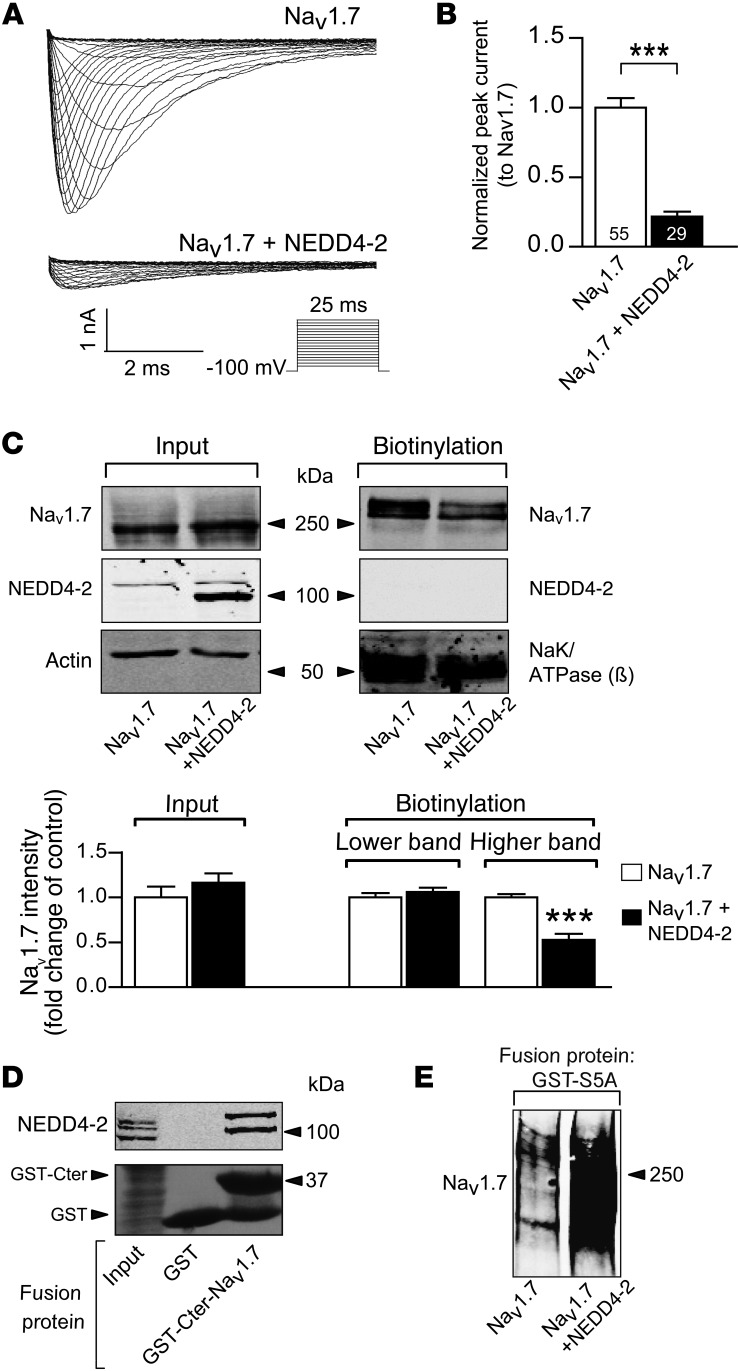
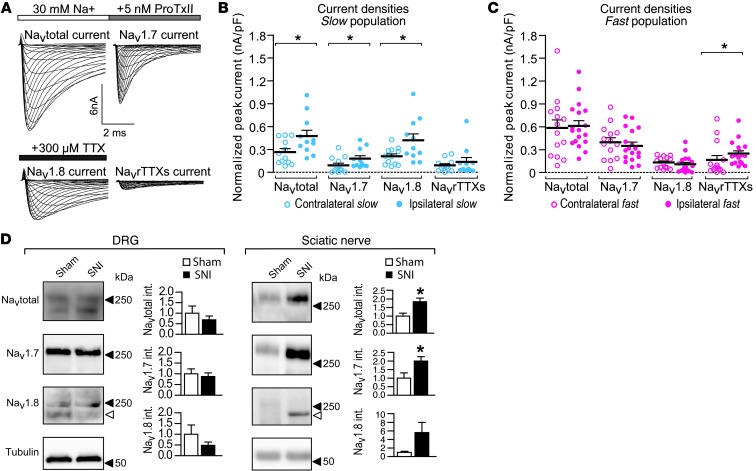
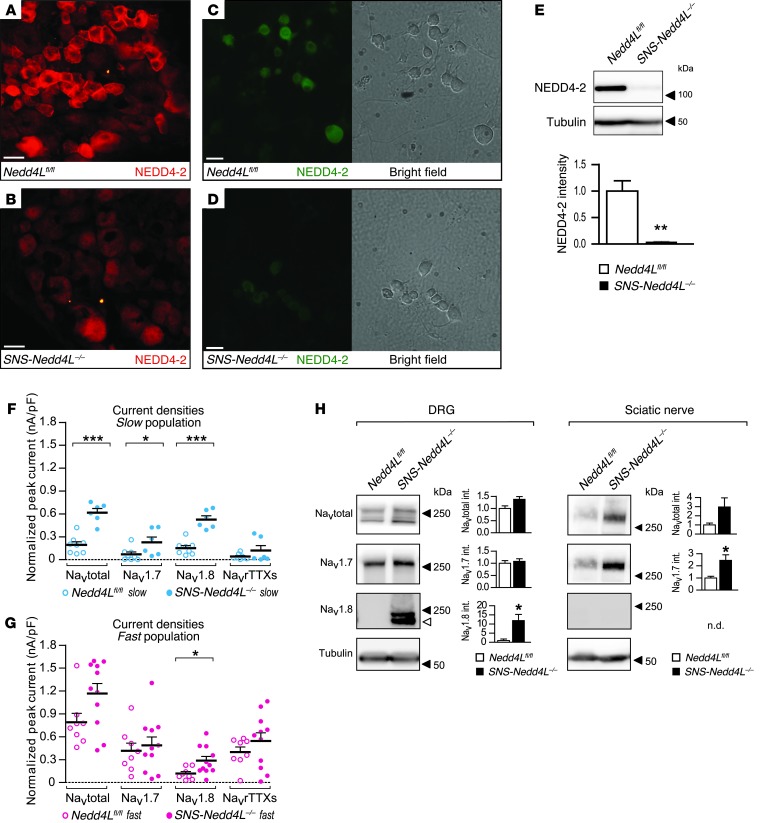
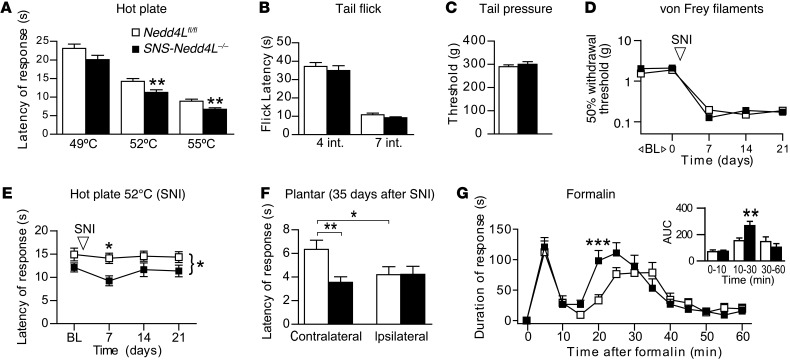
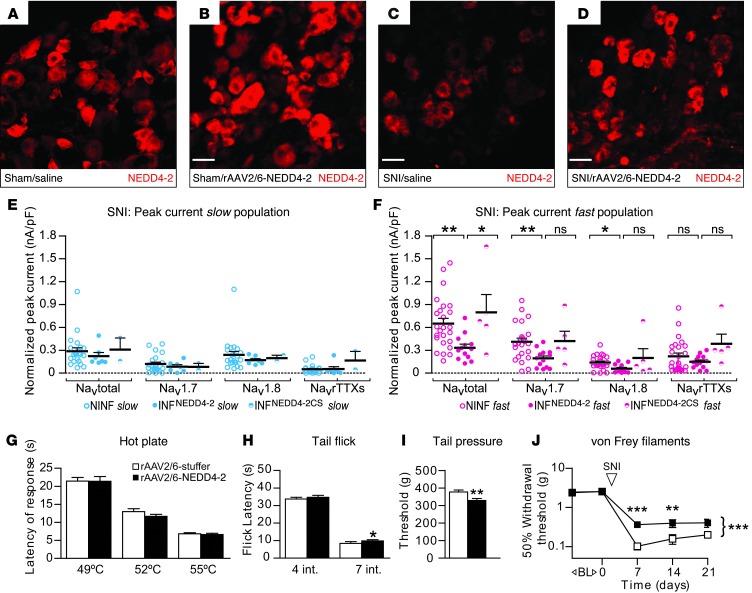
Peripheral neuropathic pain is a disabling condition resulting from nerve injury. It is characterized by the dysregulation of voltage-gated sodium channels (Navs) expressed in dorsal root ganglion (DRG) sensory neurons. The mechanisms underlying the altered expression of Na(v)s remain unknown. This study investigated the role of the E3 ubiquitin ligase NEDD4-2, which is known to ubiquitylate Navs, in the pathogenesis of neuropathic pain in mice. The spared nerve injury (SNI) model of traumatic nerve injury-induced neuropathic pain was used, and an Na(v)1.7-specific inhibitor, ProTxII, allowed the isolation of Na(v)1.7-mediated currents. SNI decreased NEDD4-2 expression in DRG cells and increased the amplitude of Na(v)1.7 and Na(v)1.8 currents. The redistribution of Na(v)1.7 channels toward peripheral axons was also observed. Similar changes were observed in the nociceptive DRG neurons of Nedd4L knockout mice (SNS-Nedd4L(-/-)). SNS-Nedd4L(-/-) mice exhibited thermal hypersensitivity and an enhanced second pain phase after formalin injection. Restoration of NEDD4-2 expression in DRG neurons using recombinant adenoassociated virus (rAAV2/6) not only reduced Na(v)1.7 and Na(v)1.8 current amplitudes, but also alleviated SNI-induced mechanical allodynia. These findings demonstrate that NEDD4-2 is a potent posttranslational regulator of Na(v)s and that downregulation of NEDD4-2 leads to the hyperexcitability of DRG neurons and contributes to the genesis of pathological pain.


Figures

Figure 1
Figure 1. Peripheral nerve injury reduces NEDD4-2 expression in DRG.
(A and B) Immunofluorescence of NEDD4-2 in coronal sections of L4 DRG from sham-operated and SNI mice. Scale bars: 30 μm. (C) Representative Western blot analysis showing the decrease in NEDD4-2 at days 7, 21, and 42 after SNI in L4/5 DRG and its associated quantification. Data are expressed as the means ± SEM; n = 4 samples for each time point per group. ***P < 0.001 by 1-way ANOVA with Bonferroni’s post-hoc test. GAPDH was used as a loading control. Lanes were run on the same gel but were noncontiguous. (D) Effect of SNI and SNL on Nedd4-1 and Nedd4L transcripts in L4/5 DRG 7 days after SNI or SNL (injury of L5 spinal nerve). Bar graph showing transcriptional levels of Nedd4-1 and Nedd4L normalized to GAPDH in SNI and SNL groups over the control group (sham for SNI and L4 DRG for SNL). Data represent the mean ± SEM; n = 4 samples per group. Isolated L4/5, L5, or L4 DRG from 2 mice were pooled for each sample and run in triplicate. *P = 0.011, **P = 0.004, Student’s t test. (E) Constitutive transcript levels of Nedd4/Nedd4-like E3 subfamily members in L4/5 DRG 7 days after sham and SNI surgery. Transcript levels were normalized using HPRT as a reference gene and further normalized to Nedd4L levels in sham-operated mice. Data are expressed as the means ± SEM; n = 3–4 samples per group, which were run in triplicate. **P = 0.005, Student’s t test. We detected no amplification of NedL1 in the DRG samples.
Figure 2
Figure 2. NEDD4-2 downregulates membrane Nav1.7.
(A) Representative current traces obtained with a V-I protocol (see Methods) on HEK293 cells after Nav1.7 transfection or cotransfection with NEDD4-2. (B) Quantification of current densities from A. NEDD4-2 reduced Nav1.7 current density (***P < 0.001). See Supplemental Figure 1A and Supplemental Table 1 for values and biophysical properties. (C) Surface biotinylation of HEK293 cells and their associated quantification. In membrane fractions, NEDD4-2 reduced the fully glycosylated form of Nav1.7 (***P < 0.001), whereas the core glycosylated form remained unchanged (P = 0.416). Nav1.7 total expression was unchanged (P = 0.337; Input). The β1 subunit of the NaK/ATPase and actin were used as loading controls in input and biotinylation fractions, respectively. Deglycosylation experiments are presented in Supplemental Figure 1B. NEDD4-2 antibody recognizes both endogenous (120 kDa) and transfected (100 kDa) proteins. (D) GST pull-down experiment showing Nav1.7 PY motif interaction with NEDD4-2. HEK293 cells were transfected with NEDD4-2, and soluble fractions were mixed GST proteins or GST-Cter-Nav1.7 fusion proteins. Bound NEDD4-2 was analyzed by Western blot. The entire Western blot with PY motif mutants can be seen in Supplemental Figure 2E. (E) NEDD4-2–mediated ubiquitylation. HEK293 cells were transfected with Nav1.7 or cotransfected with NEDD4-2, and soluble fractions were mixed with GST-S5A proteins to pull down ubiquitylated proteins. Bound Nav1.7 was analyzed by Western blotting. The entire Western blot with PY motif mutants can be seen in Supplemental Figure 2F.
Figure 3
Figure 3. Increase in Nav1.7 and Nav1.8 currents in DRG neurons and increased expression of Nav1.7 along the sciatic nerve after SNI.
(A) Typical recordings of INa in DRG neurons using the V-I protocol and pharmacological isolation of Navtotal, Nav1.7, Nav1.8, and NavrTTXs currents with ProTxII and TTX (see Methods). (B and C) Scatter dot plot representing Navtotal, Nav1.7, Nav1.8, and NavrTTXs current densities in contralateral and ipsilateral sides recorded in L4/5 DRG neurons 1 week after SNI. Slow (B, in cyan) and fast (C, in magenta) neurons are shown. Mann-Whitney U test. See Supplemental Figure 3A for the total population and see Supplemental Table 2 for values and biophysical properties. (D) Left panel: representative Western blot analysis and quantification of Nav α subunits: Navtotal, Nav1.7, and Nav1.8 in DRG 7 days after SNI. No modifications in Navtotal (P = 0.496), Nav1.7 (P = 0.690), or Nav1.8 (P = 0.311) were observed in sham- and SNI-operated mice. Right panel: same as above, but for sciatic nerve preparation. Nav1.7 (*P = 0.045) and Navtotal (*P = 0.021) were significantly increased in SNI compared with the sham samples. The Nav1.8 signal in the SNI sample did not reach significance compared with the background signal in the sham-operated group (P = 0.105) (see Supplemental Figure 3B). The 2 open arrowheads correspond to a distinct band of Nav1.8, with lower molecular weight than the band observed at 250 kDa. Data are expressed as the means ± SEM; n = 4 samples for each group. Student’s t test. Tubulin was used as a loading control. Int., intensity.
Figure 4
Figure 4. SNS-Nedd4L–/– mice show increased Nav1.7 and Nav1.8 currents in DRG neurons and increased expression of Nav1.7 along the sciatic nerve.
(A and B) Immunofluorescence of NEDD4-2 in coronal sections of L4 DRG from Nedd4Lfl/fl and SNS-Nedd4L–/– mice. Scale bars: 30 μm. (C and D) Immunofluorescence and corresponding bright-field images of NEDD4-2 in DRG neurons from Nedd4Lfl/fl and SNS-Nedd4L–/– mice after whole-cell patch-clamp recordings (36 hours after dissociation). Scale bars: 30 μm. (E) Western blot and quantification showing NEDD4-2 decrease in the DRG (**P = 0.003) of SNS-Nedd4L–/– mice compared with control Nedd4Lfl/fl mice. (F and G) Scatter dot plots representing Navtotal, Nav1.7, Nav1.8, and NavrTTXs current densities in L4/5 DRG neurons from SNS-Nedd4L–/– and Nedd4Lfl/fl mice. Slow (F, in cyan) and fast (G, in magenta) neurons are shown. Mann-Whitney U test. See Supplemental Figure 4A for total population and Supplemental Table 3 for values and biophysical properties. (H) Left panel: Western blot analysis and quantification of Nav α subunits in the DRG of SNS-Nedd4L–/– and Nedd4Lfl/fl mice. No significant modifications in Navtotal (P = 0.054) or Nav1.7 (P = 0.646) were observed, whereas the Nav1.8 signal was increased in the SNS-Nedd4L–/– mice (*P = 0.020). Right panel: same as above, but for sciatic nerves. Nav1.7 was significantly increased (*P = 0.022), whereas the increase in Navtotal was not significant (P = 0.089). Data are expressed as the means ± SEM; n = 4 samples for each group. Student’s t test. Tubulin was used as a loading control in E and H.
Figure 5
Figure 5. SNS-Nedd4L–/– mice show increased thermal sensitivity and an increased second pain phase after formalin injection.
(A) Significantly higher thermal sensitivity was detected in the hot-plate test at 52°C and 54°C in SNS-Nedd4L–/– mice. P = 0.112 at 49°C, **P = 0.009 at 52°C, and **P = 0.008 at 55°C; Mann-Whitney U test. (B) No differences were observed in the tail-flick test. P = 0.414 at intensity 4 and P = 0.830 at intensity 7 (AU); Mann-Whitney U test. (C) Responses to the tail pressure test were unchanged. P = 0.452, Student’s t test. (D) Basal responses to mechanical stimulation and development of SNI-related mechanical allodynia-like behavior were not different. P > 0.05, 2-way ANOVA on log values with post-hoc Bonferroni’s tests. (E) Higher thermal sensitivity was detected at 52°C in SNS-Nedd4L–/– mice, but this effect was not further increased after SNI. *P < 0.05 between groups using 2-way ANOVA with repeated measures. *P < 0.05 on day 7 with post-hoc Bonferroni’s tests. (F) Plantar test 35 days after SNI. Higher thermal sensitivity was detected in SNS-Nedd4L–/– mice as compared with the noninjured paws of Nedd4Lfl/fl mice (contralateral). SNI induced thermal hyperalgesia in the injured paws of Nedd4Lfl/fl mice compared with noninjured paws. *P = 0.013 and **P = 0.006 at intensity 3 (AU), Student’s t test. (G) Time course of the nocifensive response to formalin injection revealed an increased response in SNS-Nedd4L–/– mice during the second phase of the test. ***P < 0.001, 2-way ANOVA with repeated measures with post-hoc Bonferroni’s tests. Insert shows the bar graph of this effect through AUC quantification. **P = 0.009, Mann-Whitney U test. Data are expressed as the means ± SEM and n = 7– 28 animals per group for all panels.
Figure 6
Figure 6. Delivery of rAAV2/6-NEDD4-2 viral vector decreases functional currents after SNI and alleviates mechanical allodynia.
(AD) Immunofluorescence of NEDD4-2 in coronal sections of L4 ipsilateral DRG injected with rAAV2/6-NEDD4-2 or saline solution in sham- and SNI-operated mice. Scale bars: 30 μm. (E and F) Scatter dot plots representing Navtotal, Nav1.7, Nav1.8, and NavrTTXs current densities 1 week after SNI in noninfected DRG neurons (NINF), rAAV2/6-NEDD4-2–infected cells (INFNEDD4–2), and in the control group infected with the rAAV2/6-NEDD4-2CS vector (INFNEDD4-2CS). Slow (E, in cyan) and fast (F, in magenta) neurons are shown. Nonparametric 1-way ANOVA (Kruskal-Wallis test) with Dunn’s post-hoc test. See Supplemental Figure 5F for total population, Supplemental Table 5 for biophysical properties and values, and Supplemental Figure 5, A–E. (G) Basal thermal sensitivity showed no difference at 49°C (P = 0.987), 52°C (P = 0.186), or 55°C (P = 0.673) in the hot-plate test between the 2 groups. Student’s t test. (H) An increase in tail-flick latency (P = 0.018 at intensity 7) for high-intensity stimulation in the rAAV2/6-NEDD4-2 group was observed. Mann-Whitney U test. (I) Tail pressure sensitivity was increased in mice infected with rAAV2/6-NEDD4-2. **P = 0.006, Student’s t test. (J) Basal responses to innocuous mechanical stimulation were not different between the 2 strands, but the development of mechanical allodynia was significantly diminished in rAAV2/6-NEDD4-2–infected mice. ***P < 0.001 at day 7 and **P < 0.01 at day 14; 2-way ANOVA on log values with post-hoc Bonferroni’s tests. Data are expressed as the mean ± SEM; n = 12–15 for rAAV2/6-stuffer and rAAV2/6-NEDD4-2.

Similar articles

Cited by

References

    1. Bouhassira D, Lanteri-Minet M, Attal N, Laurent B, Touboul C. Prevalence of chronic pain with neuropathic characteristics in the general population. Pain. 2008;136(3):380–387. doi: 10.1016/j.pain.2007.08.013. - DOI - PubMed
    1. Amir R, Michaelis M, Devor M. Membrane potential oscillations in dorsal root ganglion neurons: role in normal electrogenesis and neuropathic pain. J Neurosci. 1999;19(19):8589–8596. - PMC - PubMed
    1. Nystrom B, Hagbarth KE. Microelectrode recordings from transected nerves in amputees with phantom limb pain. Neurosci Lett. 1981;27(2):211–216. doi: 10.1016/0304-3940(81)90270-6. - DOI - PubMed
    1. Costigan M, Scholz J, Woolf CJ. Neuropathic pain: a maladaptive response of the nervous system to damage. Annu Rev Neurosci. 2009;32(1):1–32. doi: 10.1146/annurev.neuro.051508.135531. - DOI - PMC - PubMed
    1. Brackenbury WJ, Isom LL. Na channel β subunits: overachievers of the ion channel family. Front Pharmacol. 2011;2:53. - PMC - PubMed

Publication types

MeSH terms

Substances