

Triple bioluminescence imaging for in vivo monitoring of cellular processes
- PMID: 23778500
- PMCID: PMC3696905
- DOI: 10.1038/mtna.2013.25
Triple bioluminescence imaging for in vivo monitoring of cellular processes
Abstract
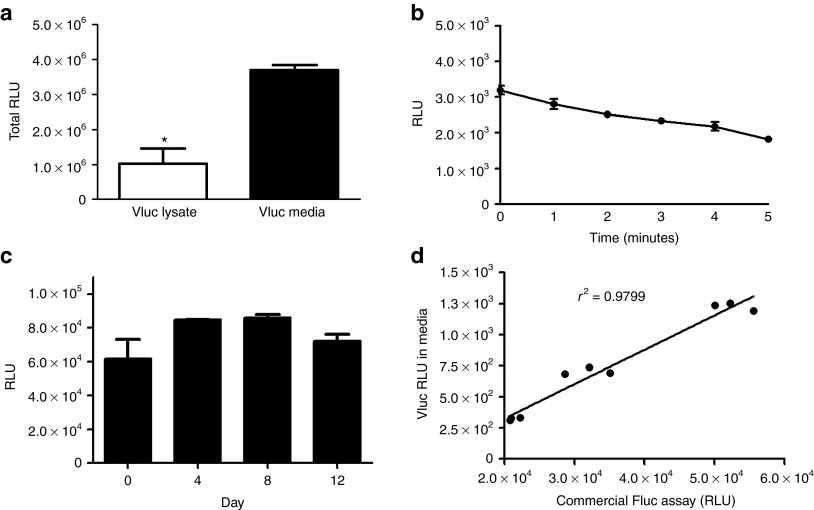
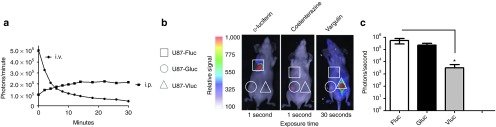
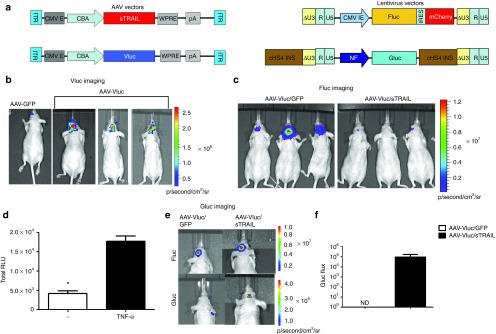
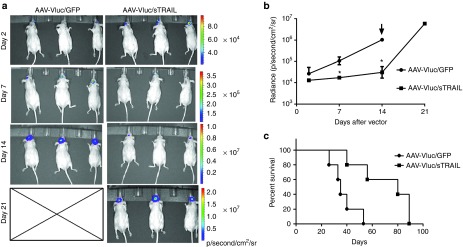
Bioluminescence imaging (BLI) has shown to be crucial for monitoring in vivo biological processes. So far, only dual bioluminescence imaging using firefly (Fluc) and Renilla or Gaussia (Gluc) luciferase has been achieved due to the lack of availability of other efficiently expressed luciferases using different substrates. Here, we characterized a codon-optimized luciferase from Vargula hilgendorfii (Vluc) as a reporter for mammalian gene expression. We showed that Vluc can be multiplexed with Gluc and Fluc for sequential imaging of three distinct cellular phenomena in the same biological system using vargulin, coelenterazine, and D-luciferin substrates, respectively. We applied this triple imaging system to monitor the effect of soluble tumor necrosis factor-related apoptosis-inducing ligand (sTRAIL) delivered using an adeno-associated viral vector (AAV) on brain tumors in mice. Vluc imaging showed efficient sTRAIL gene delivery to the brain, while Fluc imaging revealed a robust antiglioma therapy. Further, nuclear factor-κB (NF-κB) activation in response to sTRAIL binding to glioma cells death receptors was monitored by Gluc imaging. This work is the first demonstration of trimodal in vivo bioluminescence imaging and will have a broad applicability in many different fields including immunology, oncology, virology, and neuroscience.Molecular Therapy - Nucleic Acids (2013) 2, e99; doi:10.1038/mtna.2013.25; published online 18 June 2013.
Figures
Similar articles
-
Gaussia luciferase for bioluminescence tumor monitoring in comparison with firefly luciferase.Mol Imaging. 2011 Oct;10(5):377-85. doi: 10.2310/7290.2010.00057. Epub 2011 Apr 26. Mol Imaging. 2011. PMID: 21521553
-
Introducing a new reporter gene, membrane-anchored Cypridina luciferase, for multiplex bioluminescence imaging.Mol Ther Oncolytics. 2021 Mar 17;21:15-22. doi: 10.1016/j.omto.2021.03.004. eCollection 2021 Jun 25. Mol Ther Oncolytics. 2021. PMID: 33851009 Free PMC article.
-
Gaussia princeps luciferase.2008 Jan 31 [updated 2008 Feb 28]. In: Molecular Imaging and Contrast Agent Database (MICAD) [Internet]. Bethesda (MD): National Center for Biotechnology Information (US); 2004–2013. 2008 Jan 31 [updated 2008 Feb 28]. In: Molecular Imaging and Contrast Agent Database (MICAD) [Internet]. Bethesda (MD): National Center for Biotechnology Information (US); 2004–2013. PMID: 20641352 Free Books & Documents. Review.
-
ATP-binding cassette transporters modulate both coelenterazine- and D-luciferin-based bioluminescence imaging.Mol Imaging. 2011 Jun;10(3):215-26. Mol Imaging. 2011. PMID: 21496450 Free PMC article.
-
In Vivo Molecular Bioluminescence Imaging: New Tools and Applications.Trends Biotechnol. 2017 Jul;35(7):640-652. doi: 10.1016/j.tibtech.2017.03.012. Epub 2017 May 10. Trends Biotechnol. 2017. PMID: 28501458 Review.
Cited by
-
Bioluminescence: a versatile technique for imaging cellular and molecular features.Medchemcomm. 2014 Mar 1;5(3):255-267. doi: 10.1039/C3MD00288H. Epub 2013 Dec 13. Medchemcomm. 2014. PMID: 27594981 Free PMC article.
-
Bioluminescence imaging in live cells and animals.Neurophotonics. 2016 Apr;3(2):025001. doi: 10.1117/1.NPh.3.2.025001. Epub 2016 Apr 5. Neurophotonics. 2016. PMID: 27226972 Free PMC article.
-
Patient-Derived Glioma Models: From Patients to Dish to Animals.Cells. 2019 Sep 30;8(10):1177. doi: 10.3390/cells8101177. Cells. 2019. PMID: 31574953 Free PMC article. Review.
-
Development and application of bioluminescence imaging for the influenza A virus.J Thorac Dis. 2018 Jul;10(Suppl 19):S2230-S2237. doi: 10.21037/jtd.2018.02.35. J Thorac Dis. 2018. PMID: 30116602 Free PMC article. Review.
-
Quantitative in vivo dual-color bioluminescence imaging in the mouse brain.Neurophotonics. 2019 Apr;6(2):025006. doi: 10.1117/1.NPh.6.2.025006. Epub 2019 May 7. Neurophotonics. 2019. PMID: 31093514 Free PMC article.
References
-
- Contag CH, Contag PR, Mullins JI, Spilman SD, Stevenson DK, Benaron DA. Photonic detection of bacterial pathogens in living hosts. Mol Microbiol. 1995;18:593–603. - PubMed
-
- Tannous BA, Kim DE, Fernandez JL, Weissleder R, Breakefield XO. Codon-optimized Gaussia luciferase cDNA for mammalian gene expression in culture and in vivo. Mol Ther. 2005;11:435–443. - PubMed
-
- Loening AM, Wu AM, Gambhir SS. Red-shifted Renilla reniformis luciferase variants for imaging in living subjects. Nat Methods. 2007;4:641–643. - PubMed
Grants and funding
LinkOut - more resources
Full Text Sources
Other Literature Sources
Molecular Biology Databases
