

Birth weight and growth from infancy to late adolescence in relation to fat and lean mass in early old age: findings from the MRC National Survey of Health and Development
- PMID: 23779050
- PMCID: PMC3884138
- DOI: 10.1038/ijo.2013.115
Birth weight and growth from infancy to late adolescence in relation to fat and lean mass in early old age: findings from the MRC National Survey of Health and Development
Abstract
Objective: High birth weight and greater weight gain in infancy have been associated with increased risk of obesity as assessed using body mass index, but few studies have examined associations with direct measures of fat and lean mass. This study examined associations of birth weight and weight and height gain in infancy, childhood and adolescence with fat and lean mass in early old age.
Subjects: A total of 746 men and 812 women in England, Scotland and Wales from the MRC National Survey of Health and Development whose heights and weights had been prospectively ascertained across childhood and adolescence and who had dual energy X-ray absorptiometry measures at age 60-64 years.
Methods: Associations of birth weight and standardised weight and height (0-2 (weight only), 2-4, 4-7, 7-11, 11-15, 15-20 years) gain velocities with outcome measures were examined.
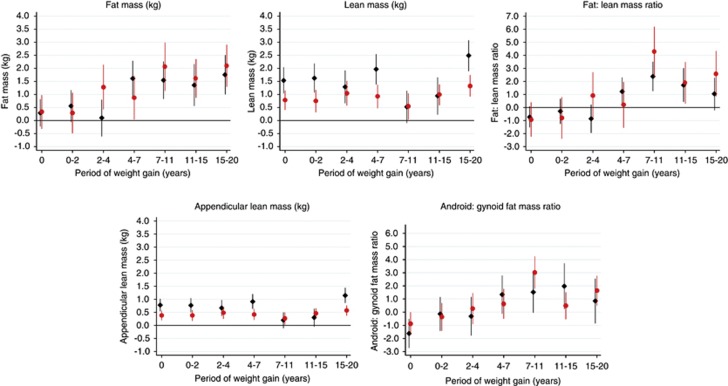
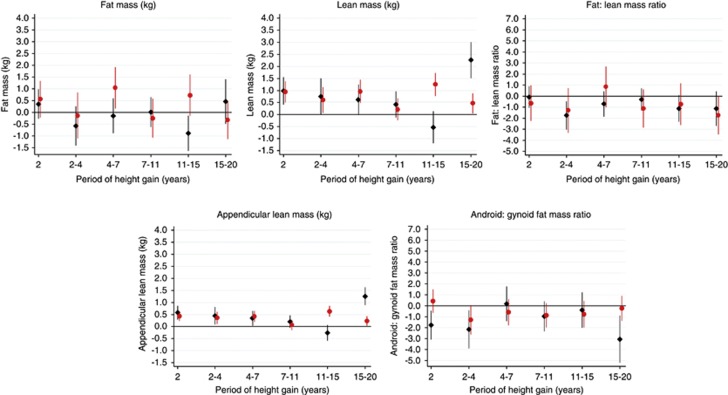
Results: Higher birth weight was associated with higher lean mass and lower android/gynoid ratio at age 60-64 years. For example, the mean difference in lean mass per 1 standard deviation increase in birth weight was 1.54 kg in males (95% confidence interval=1.04, 2.03) and 0.78 kg in females (0.41, 1.14). Greater weight gain in infancy was associated with higher lean mass, whereas greater gains in weight in later childhood and adolescence were associated with higher fat and lean mass, and fat/lean and android/gynoid ratios. Across growth intervals greater height gain was associated with higher lean but not fat mass, and with lower fat/lean and android/gynoid ratios.
Conclusion: Findings suggest that growth in early life may have lasting effects on fat and lean mass. Greater weight gain before birth and in infancy may be beneficial by leading to higher lean mass, whereas greater weight gain in later childhood and adolescence may be detrimental by leading to higher fat/lean and android/gynoid ratios.
Figures
References
-
- Dixon JB. The effect of obesity on health outcomes. Mol Cell Endocrinol. 2010;316:104–108. - PubMed
-
- Visser M, Deeg DJ, Lips P, Harris TB, Bouter LM. Skeletal muscle mass and muscle strength in relation to lower-extremity performance in older men and women. J Am Geriatr Soc. 2000;48:381–386. - PubMed
-
- Woo J, Leung J, BMI KwokT. body composition, and physical functioning in older adults. Obesity. 2007;15:1886–1894. - PubMed
-
- Hla MM, Davis JW, Ross PD, Wasnich RD, Yates AJ, Ravn P, et al. Multicenter study of the influence of fat and lean mass on bone mineral content: evidence for differences in their relative influence at major fracture sites. Am J Clin Nutr. 1996;64:354–360. - PubMed
MeSH terms
Grants and funding
LinkOut - more resources
Full Text Sources
Other Literature Sources
Medical
