. 2013 Jun 18;6(280):ra49.
doi: 10.1126/scisignal.2003411.

Inhibition of TGF-β signaling at the nuclear envelope: characterization of interactions between MAN1, Smad2 and Smad3, and PPM1A

Affiliations

Inhibition of TGF-β signaling at the nuclear envelope: characterization of interactions between MAN1, Smad2 and Smad3, and PPM1A

Benjamin Bourgeois et al. Sci Signal. .

Abstract

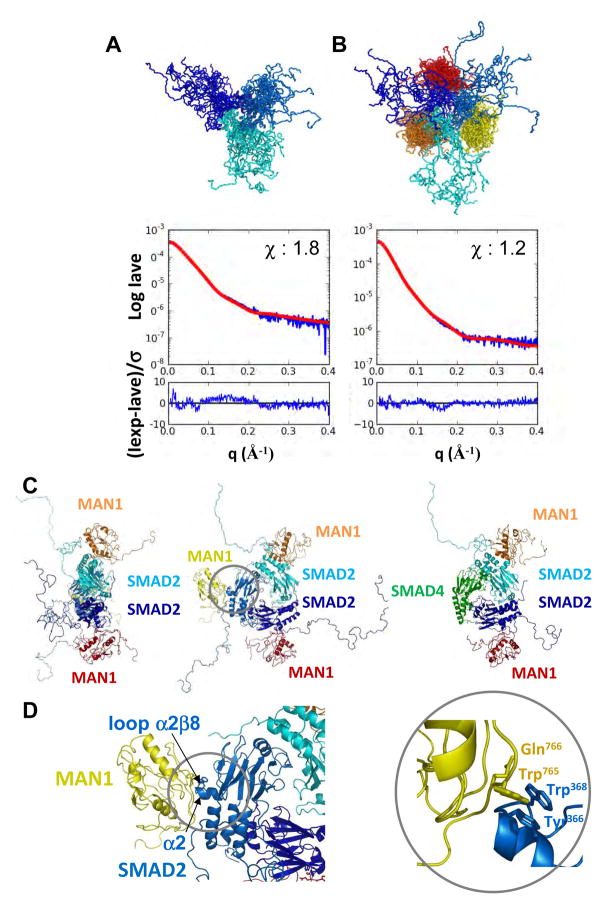
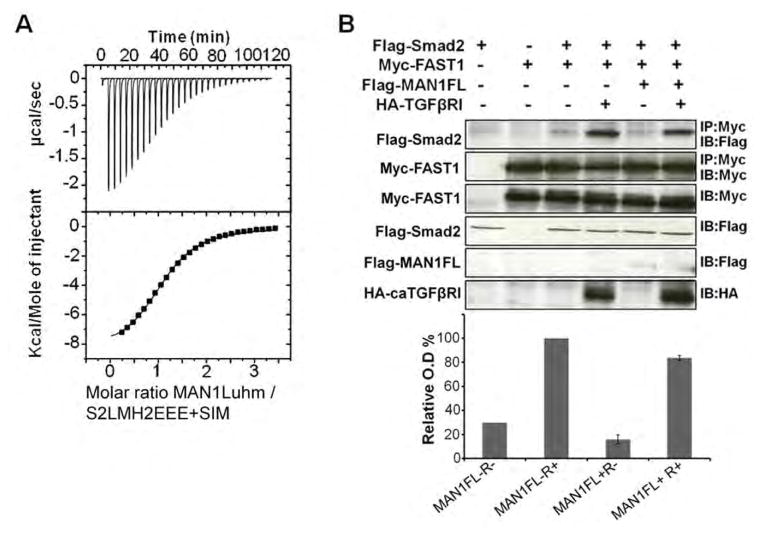
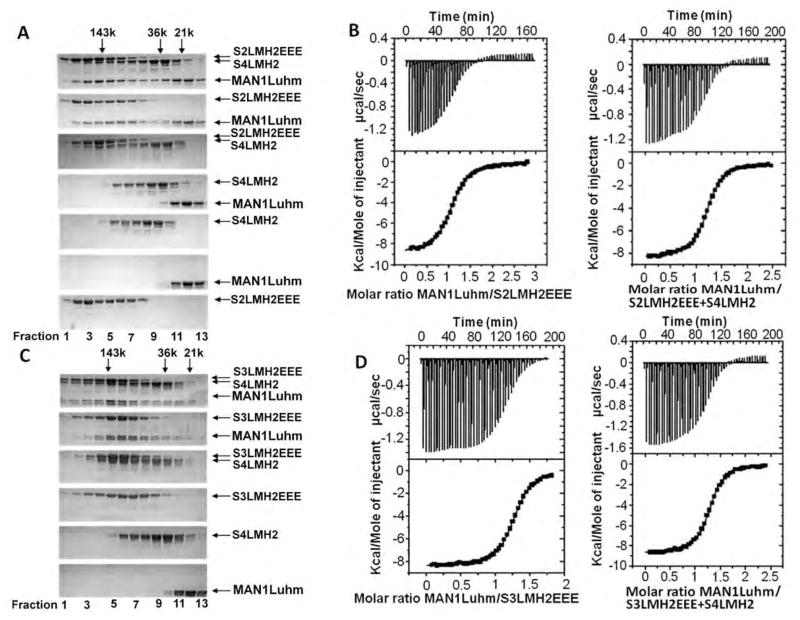
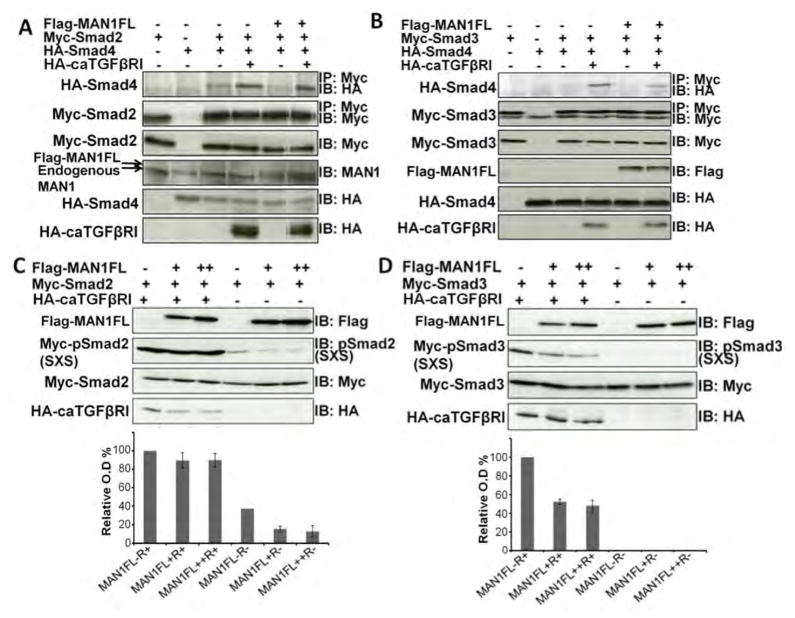
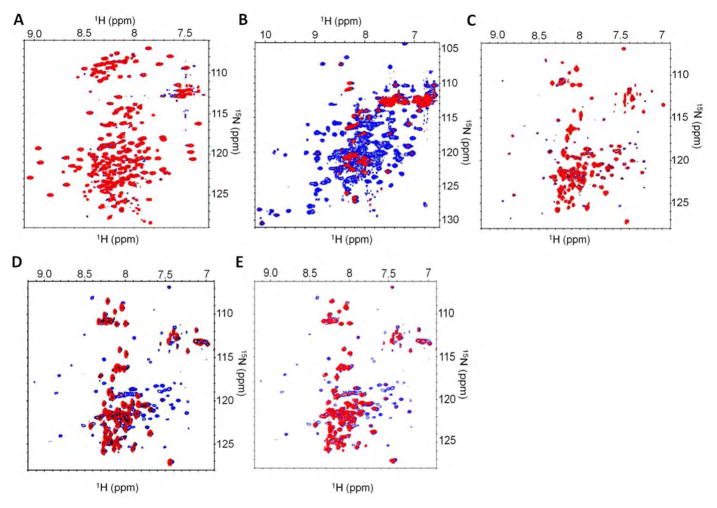
Signaling by transforming growth factor-β (TGF-β) is critical for various developmental processes and culminates in the activation of the transcription factors Smad2 and Smad3. MAN1, an integral protein of the inner nuclear membrane, inhibits TGF-β signaling by binding to Smad2 and Smad3. Depletion of the gene LEMD3 encoding MAN1 leads to developmental anomalies in mice, and heterozygous loss-of-function mutations in LEMD3 in humans cause sclerosing bone dysplasia. We modeled the three-dimensional structure of the MAN1-Smad2 complex from nuclear magnetic resonance and small-angle x-ray scattering data. As predicted by this model, we found that MAN1 competed in vitro and in cells with the transcription factor FAST1 (forkhead activin signal transducer 1) for binding to Smad2. The model further predicted that MAN1 bound to activated Smad2-Smad4 or Smad3-Smad4 complexes, which was confirmed by in vitro experiments; however, in cells, MAN1 bound only to Smad2 and Smad3 and not to the Smad4-containing complexes. Overexpression of MAN1 led to dephosphorylation of Smad2 and Smad3, thus hindering their recognition by Smad4, and MAN1 bound directly in vitro to the phosphatase PPM1A, which catalyzes the dephosphorylation of Smad2/3. These results demonstrate a nuclear envelope-localized mechanism of inactivating TGF-β signaling in which MAN1 competes with transcription factors for binding to Smad2 and Smad3 and facilitates their dephosphorylation by PPM1A.


Figures

Fig. 1
Fig. 1
Schematic representation of the MAN1, Smad2, Smad3 and Smad4 constructs used in this study. MAN1 has an N-terminal LEM motif, two transmembrane (TM) segments, a WH domain, and a UHM domain. Smad2 protein contains an MH1 and MH2 domains.
Fig 2
Fig 2
Tyr366 and Trp368 in the Smad2 MH2 domain are involved in binding to MAN1. (A) Yeast two-hybrid assay results for binding of MAN1 fragments, which included fragments containing amino acid residues 730 to 910 and full-length Smad2 variants. Top panel, protein-coding or empty plasmids were used to transform yeast for the indicated control experiments. Bottom panel, results for interactions between the MAN1 fragments and the indicated wild-type and mutant Smad2 constructs. Physical interaction between a Smad2 variant and the Man1 fragment activated expression of HIS3, which enabled yeast cell growth. N=2 independent biological replicates. (B) Chromatography elution profiles of the two Smad2 fragments S2LMH2EEE and S2LMH2EEE W366A-Y368A. N=3 independent biological replicates. (C) Representative binding curves obtained by ITC for the MAN1 fragment containing amino acid residues 755 to 911 (MAN1Luhm) added to a phosphomimetic mutant of the MH2 domain of wild-type Smad2 (S2LMH2EEE, left), and its Y366A-W388A mutant (right). Fitting these curves yielded the Kd values in Table 1.
Fig. 3
Fig. 3
Architecture of the MAN1/Smad2 complex. (A to D) Models of the phosphomimetic Smad2 fragment S2LMH2EEE either free (A) or in complex (B) with the MAN1 fragment MAN1Luhm obtained from SAXS data. In each panel, 20 models of the trimeric Smad2 fragment are superimposed (each monomer is colored in a different shade of blue). In (B), a MAN1 fragment is bound to each Smad2 fragment (each MAN1 fragment is colored in yellow, orange and red, respectively). Curves show the corresponding fit between the calculated SAXS intensity averaged on the 20 models (Iave; red) and the experimental SAXS intensity (Iexp; blue). The chi value was 1.8 in (A) and 1.2 in (B), indicating that the deviations between the calculated and experimental intensities are close to the experimental error. The difference between the two intensities divided by the experimental error is also plotted as a function of the diffusion vector amplitude. In both panels, this difference is regularly distributed around 0 on the whole q interval, as expected for a random noise-like signal. (C) shows two orthogonal views of a typical MAN1-Smad2 complex, and an additional view in which one of the Smad2 MH2 monomers has been replaced by a Smad4 MH2 monomer, which suggest that Smad2 can simultaneously bind to MAN1 and Smad4. (D) shows the MAN1-Smad2 interface. Trp765 and Gln766 in MAN1 and Tyr366 and Trp368 in Smad2 are displayed as sticks. Because Tyr366 and Trp368 in Smad2 are crucial for binding to SIM-containing transcription factors, this interface suggests that Smad2 cannot simultaneously recognize MAN1 and these transcription factors.
Fig. 4
Fig. 4
Overexpression of MAN1 leads to partial Smad2-FAST1 complex dissociation. (A) Representative binding curve obtained by ITC when MAN1Luhm was added to S2LMH2EEE bound to the Smad Interacting Motif (SIM) peptide of FAST1. Fitting these curves yielded the Kd values in Table 1. (B) Representative immunoblots showing the amount of FAST1-bound Smad2 in 293T cells transfected with plasmids expressing Flag-Smad2, Myc-FAST1, Flag-MAN1 and HA-tagged constituvely active receptor caTGFβRI as indicated above the blot. Myc immunoprecipitates containing FAST1 (IP: Myc) were immunoblotted with anti-Flag antibodies to detect Smad2 (IB: Flag; top panel). Lysates were immunoblotted as indicated (bottom four panels). The histogram shows the amount of Smad2 bound to FAST1, normalized using the amount of immunoprecipitated Myc-FAST1, from 3 independent experiments, in cells overexpressing neither MAN1 nor caTGFβRI (MAN1FL−R−), only caTGFβRI (MAN1FL−R+), only MAN1 (MAN1FL+R−) and both MAN1 and caTGFβRI (MAN1FL+R+). The signal in the MAN1FL−R+ condition was set at 100%.
Fig. 5
Fig. 5
The MAN1 fragment interacts with phosphomimetic Smad2 or Smad3 fragments complexed to a Smad4 fragment. (A) Size exclusion chromatography analysis of the interaction between MAN1Luhm (amino acids 755 to 911) and/or a phosphomimetic triple mutant of the Smad2 MH2 domain (S2LMH2EEE) and/or the Smad 4 MH2 domain (S4LMH2). N=2 independent biological replicates. (B) Representative binding curves obtained by ITC when MAN1Luhm was added to S2LMH2EEE,alone or in complex with S4LMH2. Fitting these curves yielded the Kd values in Table 1. (C) Size exclusion chromatography analysis of the interaction between MAN1Luhm and/or a phosphomimetic triple mutant of the Smad3 MH2 domain (S3LMH2EEE) and/or the MH2 of Smad4 (S4LMH2). Eluted fractions were separated on a denaturing gel and stained with Coomassie blue. N=2 independent biological replicates. (D) Representative binding curves obtained by ITC when MAN1Luhm at was added to S3LMH2EEE,alone or in complex with S4LMH2. Fitting these curves yielded the Kd values in Table 1.
Fig. 6
Fig. 6
Overexpression of MAN1 leads to partial dissociation of Smad2/Smad4 and Smad3/Smad4 complexes and to Smad2/3 dephosphorylation. (A–B) Representative immunoblots showing the amount of Smad2/3 bound to Smad4 in 293T cells transfected as indicated. Cells overexpressed caTGFβRI (MAN1FL−R+), MAN1 (MAN1FL+R−), or both MAN1 and caTGFβRI (MAN1FL+R+), or did not express either MAN1 or caTGFβRI (MAN1FL−R−). Myc immunoprecipitates containing Myc−Smad2 or Myc−Smad3 (IP: Myc) were immunoblotted with anti-HA antibodies to detect HA-Smad4 (IB: HA; top panel). The amount of immunoprecipitated Myc-Smad2 or Myc-Smad3 (IP: Myc) was detected using anti-Myc antibodies. Lysates were immunoblotted as indicated. N=2 independent biological replicates; replicate blots are in fig. S5 (C–D) Representative immunoblots showing the amount of phosphorylated Myc-Smad2 or Myc-Smad3 in 293T cells transfected with plasmids expressing Myc-Smad2 or Myc-Smad3 in the presence of increasing concentration of FLAG-MAN1 (+ and ++) with or without the constitutively active receptor HA-caTGFβRI. Cell lysates were immunoblotted as indicated (bottom three panels). The histograms show the amount of phosphorylated Myc-Smad2 and Myc-Smad3, normalized using the amount of Myc-Smad2 or Myc-Smad3, from 3 independent experiments for each condition, in cells overexpressing neither MAN1 nor caTGFβRI (MAN1FL−R−), only caTGFβRI (MAN1FL−R+), only MAN1 (MAN1FL+R− and MAN1FL++R−) and both MAN1 and caTGFβRI (MAN1FL+R+ and MAN1FL++R+). The normalized signal from the MAN1FL−R+ condition was set at 100%.
Fig. 7
Fig. 7
PPM1A binds to the C-terminal domain of MAN1. 1H-15N 2D NMR spectra were recorded on 1:0 and 1:1 ratio samples of a 15N-labeled protein and its unlabelled partner. (A) Representative HSQC spectrum of 15N-labeled fragment of MAN1 from amino acid 1 to amino acid 471 (MAN1N) with (red) or without (blue) added PPM1A. N=2 independently generated replicates. (B) Representative HSQC spectrum of 15N-labeled fragment of MAN1 from amino acid 658 to amino acid 911 (MAN1C) with (red) or without (blue) added PPM1A. (C) Representative TROSY spectrum of 15N-labeled PPM1A with (red) or without (blue) addition of the MAN1 fragment from amino acid 1 to amino acid 471 (MAN1N). N=2 independently generated replicates. (D) Representative TROSY spectrum of 15N-labeled PPM1A with (red) or without (blue) addition of the MAN1 fragment from amino acid 658 to amino acid 911 (MAN1C). N=2 independently generated replicates. (E) Representative TROSY spectrum of 15N-labeled PPM1A with (red) or without (blue) addition of the MAN1 fragment from amino acid 755 to amino acid 911 (MAN1Luhm). N=2 independently generated replicates.

Similar articles

Cited by

References

    1. Dauer WT, Worman HJ. The nuclear envelope as a signaling node in development and disease. Dev Cell. 2009;17:626–38. - PubMed
    1. Worman HJ, Bonne G. “Laminopathies”: a wide spectrum of human diseases. Exp Cell Res. 2007;313:2121–33. - PMC - PubMed
    1. Andres V, Gonzalez JM. Role of A-type lamins in signaling, transcription, and chromatin organization. J Cell Biol. 2009;187:945–57. - PMC - PubMed
    1. Barascu A, Le Chalony C, Pennarun G, Genet D, Imam N, Lopez B, Bertrand P. Oxidative stress induces an ATM-independent senescence pathway through p38 MAPK-mediated lamin B1 accumulation. Embo J. 2012;31:1080–94. - PMC - PubMed
    1. Lin F, Blake DL, Callebaut I, Skerjanc IS, Holmer L, McBurney MW, Paulin-Levasseur M, Worman HJ. MAN1, an inner nuclear membrane protein that shares the LEM domain with lamina-associated polypeptide 2 and emerin. J Biol Chem. 2000;275:4840–7. - PubMed

Publication types

MeSH terms

Substances