. 2013 Sep;231(1):21-34.
doi: 10.1002/path.4230.

Distinct evolutionary trajectories of primary high-grade serous ovarian cancers revealed through spatial mutational profiling

Affiliations
Free PMC article

Distinct evolutionary trajectories of primary high-grade serous ovarian cancers revealed through spatial mutational profiling

Ali Bashashati et al. J Pathol. 2013 Sep.
Free PMC article

Abstract

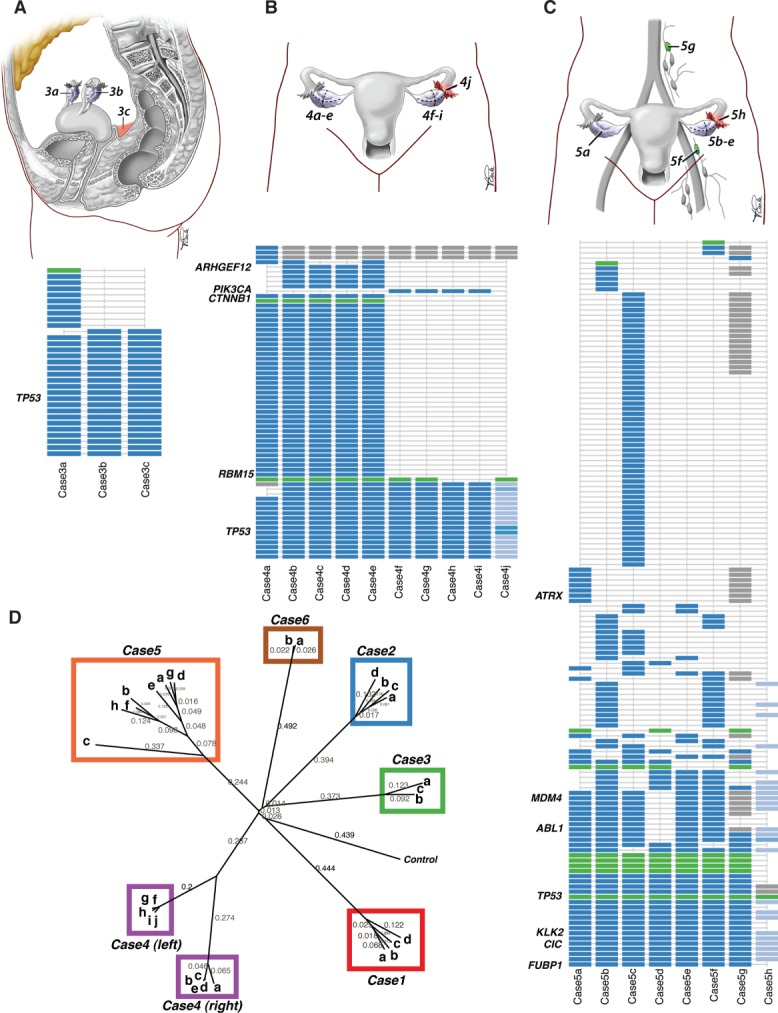
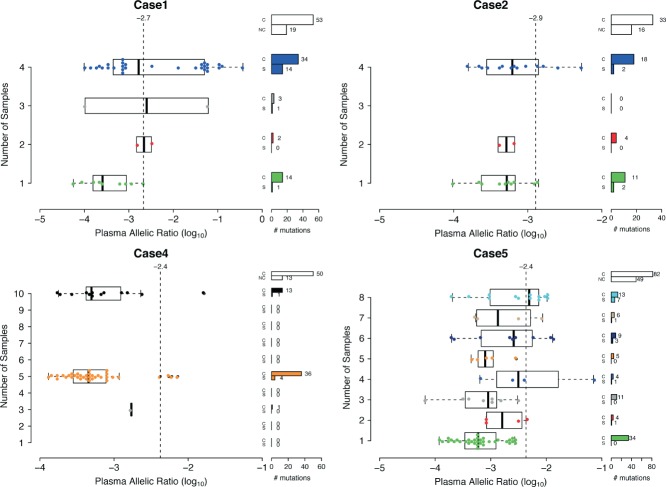
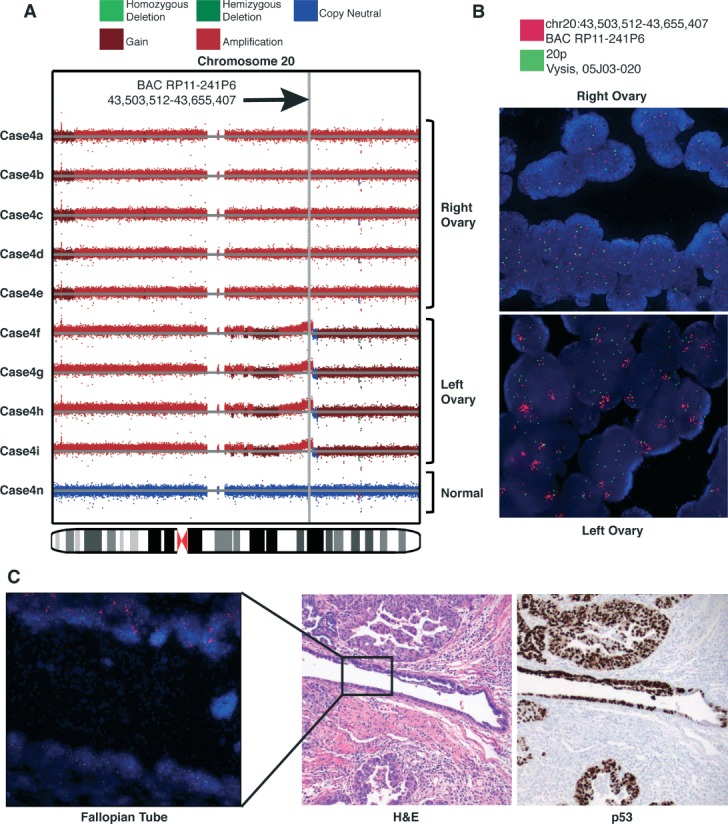
High-grade serous ovarian cancer (HGSC) is characterized by poor outcome, often attributed to the emergence of treatment-resistant subclones. We sought to measure the degree of genomic diversity within primary, untreated HGSCs to examine the natural state of tumour evolution prior to therapy. We performed exome sequencing, copy number analysis, targeted amplicon deep sequencing and gene expression profiling on 31 spatially and temporally separated HGSC tumour specimens (six patients), including ovarian masses, distant metastases and fallopian tube lesions. We found widespread intratumoural variation in mutation, copy number and gene expression profiles, with key driver alterations in genes present in only a subset of samples (eg PIK3CA, CTNNB1, NF1). On average, only 51.5% of mutations were present in every sample of a given case (range 10.2-91.4%), with TP53 as the only somatic mutation consistently present in all samples. Complex segmental aneuploidies, such as whole-genome doubling, were present in a subset of samples from the same individual, with divergent copy number changes segregating independently of point mutation acquisition. Reconstruction of evolutionary histories showed one patient with mixed HGSC and endometrioid histology, with common aetiologic origin in the fallopian tube and subsequent selection of different driver mutations in the histologically distinct samples. In this patient, we observed mixed cell populations in the early fallopian tube lesion, indicating that diversity arises at early stages of tumourigenesis. Our results revealed that HGSCs exhibit highly individual evolutionary trajectories and diverse genomic tapestries prior to therapy, exposing an essential biological characteristic to inform future design of personalized therapeutic solutions and investigation of drug-resistance mechanisms.

Keywords: clonal evolution; high-grade serous ovarian cancer; intratumoural heterogeneity.


Figures

Figure 1
Figure 1
Intratumoural mutational profiles of HGS ovarian cancer. Anatomical sites and intratumoural mutational profile for cases 3 (A), 4 (B) and 5 (C); point mutations are shown in blue, indels in green; grey indicates a predicted mutation where validation by deep sequencing was inconclusive; light blue indicates allelic frequencies (counts of non-reference allele/total depth of coverage) in the fallopian tube lesion. (D) Phylogenetic tree of mutational profiles of cases 1–6, depicting evolutionary branching patterns reflective of clonal relationships between samples. The tree was computed using distance matrices based on Pearson correlation coefficients, followed by neighbour-joining cluster analysis. The control sample represents the ‘root’ whereby data were generated with no aberrations. Neighbour-joining distances are shown along the branches of the tree, which reflect genetic distances between branching points; longer branches indicate more genomic differences.
Figure 2
Figure 2
Deep sequencing results of cell-free circulating tumour DNA from the plasma in cases 1, 2, 4 and 5. The distribution of plasma variant allelic ratio (log10 scale) is separated by the number of tumour samples in which the mutation was originally discovered. Cases 4 and 5 both also include the fallopian tube when counting the number of tumour samples. The number of mutations based on positions with coverage (c), no coverage (nc) and those with coverage that were significantly (s) detected, based on the binomial exact test (adjusted p < 0.05), are shown. The minimum variant allelic ratio detectable using the exact test for each patient is denoted by the vertical dashed line.
Figure 3
Figure 3
Intratumoural genomic architecture profiles of HGS ovarian cancer. Genomic copy number architecture of intrapatient samples using Circos; samples are arrayed in concentric circles as whole-genome profiles for cases 3 (A), 4 (B) and 5 (C). Colours represent the various copy number states: dark blue, segmental homozygous deletions; blue, hemizygous deletions; red, segmental gains; dark red, amplifications. Amplitude of each segment on the track represents the logR value of the segmental copy number change.
Figure 4
Figure 4
(A) Copy number alteration (CNA) and (B) fluorescence in situ hybridization (FISH) comparisons between right (a–e) and left (f–i) ovaries of case 4 at chromosome 20. The 20p control probe is labelled in spectrum green (Vysis, cat. no. 30–2520200), and Region 2 using BAC RP11-241P6 is labelled with spectrum orange (Vysis, Nick Translation Kit, cat. no. 32–801300). Right ovary (a–e) shows aneuploidic gain; left ovary (f–i) shows amplification of Region 2. (C) Both populations of cells carrying the chr20 CNA are found in the molecularly fixed, paraffin-embedded, early tubal high-grade serous carcinoma of the left fallopian tube (FT). FT FISH image corresponds to box inset in the H&E serial section shown at ×20 magnification. p53 immunopositivity highlights FT lesion in serial section, consistent with the presence of the same TP53 missense mutation (g.chr17, 7577565 T > C; c.716A > G; p.N239S) in all case 4 samples. Magnifications = (IHC image) ×20; (FISH images) ×63.
Figure 5
Figure 5
Evolutionary sequential compound copy number analysis. (A) Analysis of proportion of the genome that was altered by sequential compound events. Compound events include copy neutral LOH (NLOH) and amplified LOH (ALOH) regions, which indicates the occurrence of more than one copy number event in sequence (eg deletion followed by amplification of remaining allele results in ALOH). (B) Pairwise comparison of copy number samples within case 3. The number of genes with a specific predicted discrete copy number (CN) is represented by the size of the dot. Genes that also have the same zygosity (LOH or heterozygous) status between the two samples are coloured red; otherwise they are grey. (C) Doubling of chromosome 18 in case 3b relative to case 3a. Deletion (green) in 18q in 3a is observed as NLOH (blue) in 3b; amplification of 18p in 3b is balanced, indicating doubling of both diploid alleles in 3a. ‘A’ and ‘B’ genotypes are used to denote the two alleles. (D) Phylogenetic tree of discrete compound events. Genes were assigned an integer value representing the weight of observing compound events: 2, ALOH; 2, NLOH; 2, homozygous deletion; 1, hemizygous deletion; 0, diploid heterozygous; 0, allele-specific amplification. Euclidean distance was computed between pairs of tumour samples and a control (which consists of zeros for all genes) and neighbour-joining cluster analysis was used to generate the tree.
Figure 6
Figure 6
Intra-sample clonal diversity spectrum of HGSCs. (A) Distribution of cellular frequency estimates over mutations in each sample (estimated using PyClone), indicating statistically significant variation both within and between samples of the same case. (B–G) Profile of cellular frequencies for all cases, where darker shades of red indicate increasing cellular frequency estimates.
Figure 7
Figure 7
(A) Hierarchical clustering of the expression data in a cohort consisting of 594 TCGA HGSC samples and 29 HGSC samples, representing six cases analysed in this paper. The bars show four patient groups according to the hierarchical clustering of the samples (top bar), patient labels according to Tothill et al classification (middle bar), and distribution of our samples across all 623 samples. Clusters C1, 2, 4, 5 from Tothill et al correspond to differentiated, mesenchymal, immunoreactive and proliferative labels shown in the figure. (B) Simultaneous analysis of mutations and expression profiles by DriverNet, nominating the mutations that had significant impact on expression networks.

References

    1. Piccart MJ, Bertelsen K, James K, et al. Randomized intergroup trial of cisplatin–paclitaxel versus cisplatin–cyclophosphamide in women with advanced epithelial ovarian cancer: three-year results. J Natl Cancer Inst. 2000;92::699–708. - PubMed
    1. Ahmed AA, Etemadmoghadam D, Temple J, et al. Driver mutations in TP53 are ubiquitous in high-grade serous carcinoma of the ovary. J Pathol. 2010;221::49–56. - PMC - PubMed
    1. Network CGAR. Integrated genomic analyses of ovarian carcinoma. Nature. 2011;474::609–615. - PMC - PubMed
    1. Risch HA, McLaughlin JR, Cole DEC, et al. Population BRCA1 and BRCA2 mutation frequencies and cancer penetrances: a kin–cohort study in Ontario, Canada. J Natl Cancer Inst. 2006;98::1694–1706. - PubMed
    1. Geisler JP, Hatterman-Zogg MA, Rathe JA, et al. Frequency of BRCA1 dysfunction in ovarian cancer. J Natl Cancer Inst. 2002;94::61–67. - PubMed

Publication types