. 2013 Aug 12;173(15):1447-56.
doi: 10.1001/jamainternmed.2013.6886.

Delivery system integration and health care spending and quality for Medicare beneficiaries

Affiliations

Delivery system integration and health care spending and quality for Medicare beneficiaries

J Michael McWilliams et al. JAMA Intern Med. .

Abstract

Importance: The Medicare accountable care organization (ACO) programs rely on delivery system integration and health care provider risk sharing to lower spending while improving quality of care.

Objective: To compare spending and quality between larger and smaller provider groups and examine how size-related differences vary by 2 factors considered central to ACO performance: group primary care orientation and financial risk sharing by health care providers.

Evidence review: Using 2009 Medicare claims and linked American Medical Association Group Practice data, we assigned 4.29 million beneficiaries to health care provider groups based on primary care use. We categorized group size according to eligibility thresholds for the Shared Savings (≥5000 assigned beneficiaries) and Pioneer (≥15,000) ACO programs and distinguished hospital-based from independent groups. We assessed the primary care orientation of larger groups' specialty mix and used health maintenance organization market penetration and data from the Community Tracking Study to measure the extent of financial risk accepted by different types of provider groups in different areas for managed care patients. We estimated linear regression models comparing spending and quality between larger and smaller health care provider groups, allowing size-related differences to vary by measures of group primary care orientation and risk sharing. Spending and quality measures included total medical spending, spending by type of service, 5 process measures of quality, and 30-day readmissions, all adjusted for sociodemographic and clinical characteristics.

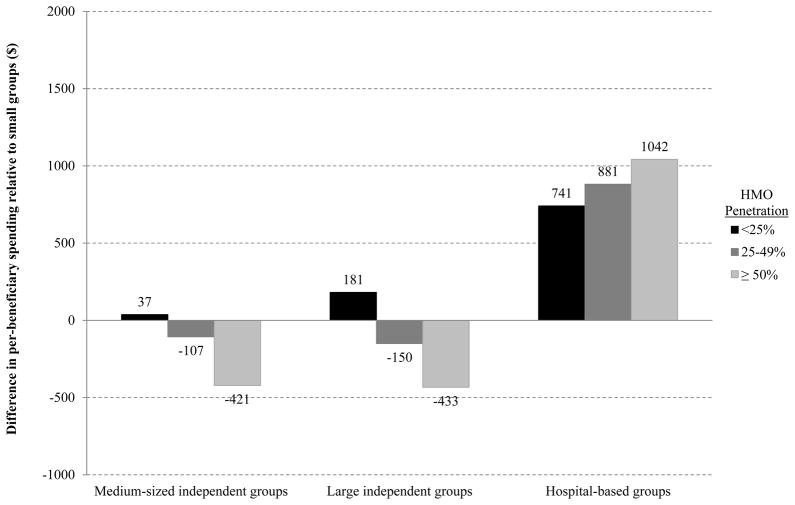
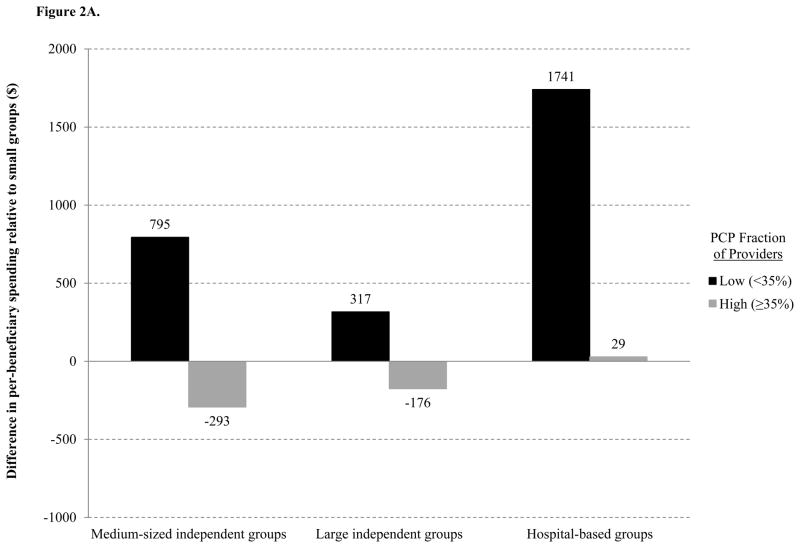
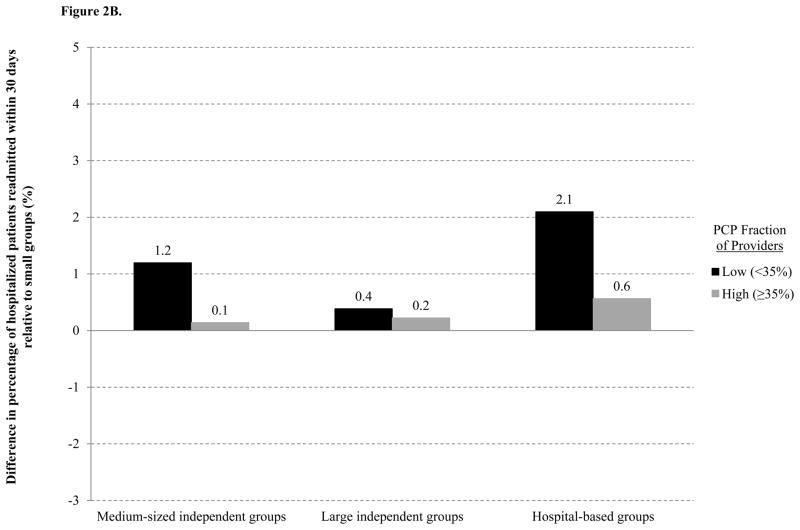
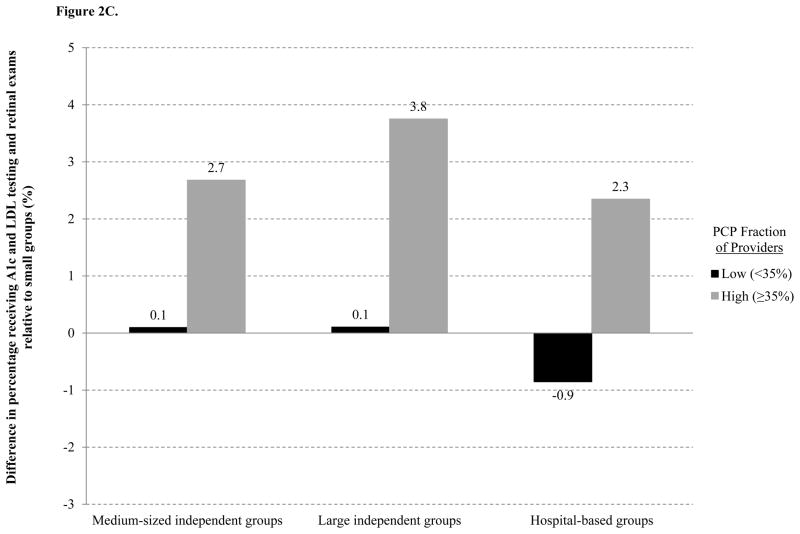
Findings: Compared with smaller groups, larger hospital-based groups had higher total per-beneficiary spending in 2009 (mean difference, +$849), higher 30-day readmission rates (+1.3 percentage points), and similar performance on 4 of 5 process measures of quality. In contrast, larger independent physician groups performed better than smaller groups on all process measures and exhibited significantly lower per-beneficiary spending in counties where risk sharing by these groups was more common (-$426). Among all groups sufficiently large to participate in ACO programs, a strong primary care orientation was associated with lower spending, fewer readmissions, and better quality of diabetes care.

Conclusions and relevance: Spending was lower and quality of care better for Medicare beneficiaries served by larger independent physician groups with strong primary care orientations in environments where health care providers accepted greater risk.


Conflict of interest statement

Financial disclosures: The authors have no potential conflicts of interest to disclose.

Figures

Figure 1
Figure 1. Differences in total per-beneficiary spending between larger and smaller provider groups, by HMO penetration
Differences between groups sufficiently large to participate in ACO programs and the reference category of small groups are displayed by HMO penetration. Increasing HMO penetration from low (<25%) to high (≥50%) was associated with decreases in total per-beneficiary spending for medium-sized and large independent physician groups, relative to small groups (differential reductions: −$458 for medium-sized and −$614 for large independent groups; P<0.001). In counties with high HMO penetration, total per-beneficiary spending was $421 to $433 lower (P<0.001) for these groups than for small groups. As expected from the weaker relationship between HMO penetration and financial risk sharing by hospital-based groups (Table 1), differences in spending between hospital-based and small groups did not diminish with increasing HMO penetration.
Figure 2
Figure 2. Differences between larger and smaller provider groups in A) total per-beneficiary spending, B) 30-day readmission rates, and C) quality of diabetes care, by group primary care orientation
Differences between groups sufficiently large to participate in ACO programs and the reference category of small groups are displayed by primary care orientation of larger groups’ specialty mix. Relative to small groups, total per-beneficiary spending was higher, 30-day readmission rates mostly higher, and quality of diabetes care similar or slightly worse for larger groups with low primary care fractions of physicians. In contrast, for groups with high primary care fractions of physicians, spending was similar or lower, readmission rates mostly similar, and quality of diabetes care consistently better. Thus, a specialty mix with a high primary care fraction was associated with (A) reduced differences between small and larger groups in total per-beneficiary spending (reduction in difference: −$492 to −$1,712; P<0.001), (B) reduced differences in 30-day readmission rates (−1.1 to −1.5 percentage points; P<0.001) except for large independent physician groups (−0.2 percentage points; P=0.61), and (C) increased differences indicating better quality of diabetes care (+2.6 to +3.6 percentage points in the fraction of beneficiaries receiving all three diabetes services; P<0.001).

Comment in

Similar articles

Cited by

References

    1. Center for Medicare and Medicaid Innovation. [Accessed March 6, 2013];Pioneer ACO Alignment and Financial Reconciliation Methods. 2011 http://innovations.cms.gov/Files/x/Pioneer-ACO-Model-Benchmark-Methodolo....
    1. Department of Health and Human Services and Centers for Medicare and Medicaid Services. Medicare program; Medicare Shared Savings Program: accountable care organizations. [Accessed March 6, 2013];Final rule. 2011 http://www.gpo.gov/fdsys/pkg/FR-2011-11-02/pdf/2011-27461.pdf.
    1. Crosson FJ. Medicare: the place to start delivery system reform. Health Aff (Millwood) 2009;28:w232–234. - PubMed
    1. Fisher ES, McClellan MB, Bertko J, et al. Fostering accountable health care: moving forward in Medicare. Health Aff (Millwood) 2009;28:w219–231. - PMC - PubMed
    1. Robinson JC, Casalino LP. Vertical integration and organizational networks in health care. Health Aff (Millwood) 1996;15:7–22. - PubMed

Publication types