. 2013 Dec;23(12):1179-88.
doi: 10.1002/hipo.22156. Epub 2013 Jul 13.

Hippocampal network connections account for differences in memory performance in the middle-aged rhesus monkey

Affiliations

Hippocampal network connections account for differences in memory performance in the middle-aged rhesus monkey

Bang-Bon Koo et al. Hippocampus. 2013 Dec.

Abstract

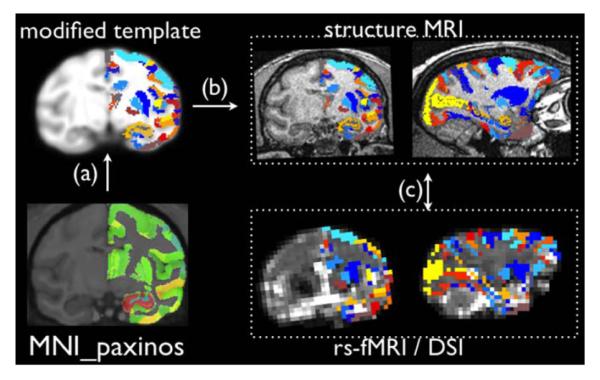
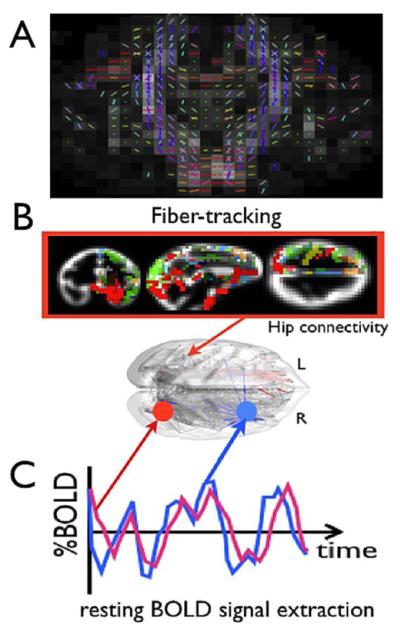
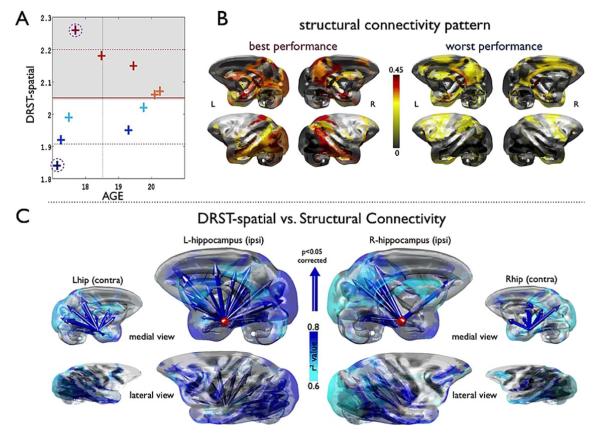
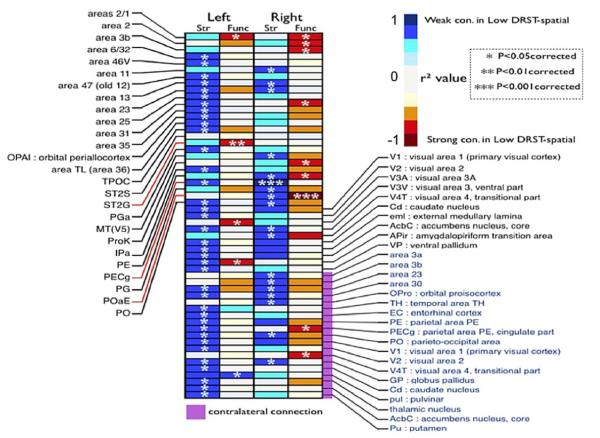
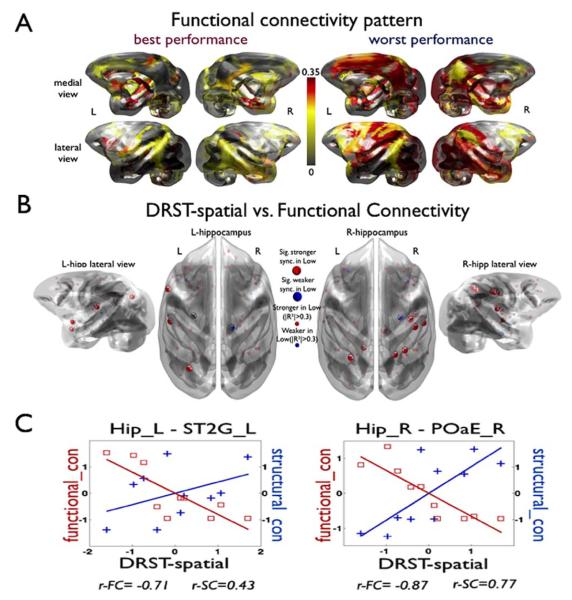
Recent neurophysiological and functional neuroimaging studies suggest that the memory decline found with normal aging is not solely due to regional disruptions in the hippocampus, but also is brought about by alterations in the functional coupling between the hippocampus and long-distance neocortical regions. However, the anatomical basis for this functional "dyscoupling" has not been fully revealed. In this study, we applied a multimodal magnetic resonance imaging technique to noninvasively examine the large-scale anatomical and functional hippocampal network of a group of middle aged rhesus monkeys. Using diffusion spectrum imaging, we have found that monkeys with lower memory performance had weaker structural white matter connections between the hippocampus and neocortical association areas. Resting state functional imaging revealed somewhat of an opposite result. Monkeys with low memory performance displayed elevated coupling strengths in the network between the hippocampus and the neocortical areas. Taken together with recent findings, this contradictory pattern may be the result of either underlying physiological burden or abnormal neuronal decoupling due to the structural alterations, which induce a neuronal compensation mechanism for the structural loss or interference on task related neuronal activation, respectively.

Keywords: TEA; chemical LTD; chemical LTP; glycine; spine remodeling.


Figures

FIGURE 1
FIGURE 1
Automatic labeling of both rs-fMRI and DSI. [Color figure can be viewed in the online issue, which is available at wileyonlinelibrary.com.]
FIGURE 2
FIGURE 2
Structural and functional hippocampal network reconstruction. Reconstructions on one rhesus monkey are shown in this figure. Overlayed figure of local white matter orientation (colored lines) and diffusion spectrum image data is shown in panel A. Panel B shows 10,000 iterative fiber tracking from left hippocampus to its ipsi-lateral cortex. Colors other than red indicates cortical regions of interests (ROIs). Low frequency resting BOLD fluctuations in different regions are illustratied in Panel C. [Color figure can be viewed in the online issue, which is available at wileyonlinelibrary.com.]
FIGURE 3
FIGURE 3
Short-term memory performance of monkeys and their structural connections. The spatial condition of delayed recognition span (DRST-spatial) test of monkeys are shown in Panel A. Red horizontal line indicates mean DRST-spatial score and red dotted line shows standard deviation. Monkeys with DRST-spatial over the mean are plotted in orange to red cross. Below mean DRST-spatial score are plotted in light to dark blue cross. Dotted circles indicate the monkeys used for sample figures, shown in Panal B. Panel B shows hippocampal structural connection pattern in highest and lowest DRST-spatial test score monkeys. Dominant hippocampal–neocortical connections are shown in red color while the gray and yellow color shows no or weak connections. Panel C shows the correlation analysis result on the relationship between structural connection and DRST-spatial test. Statistically significant (P < 0.05, corrected) memory related structural connection loss are depicted in dark blue arrow. Also, connections with high r square values are shown in light to dark blue in the cortical surface. Small figures in left and right marginal side shows contralateral connections. [Color figure can be viewed in the online issue, which is available at wileyonlinelibrary.com.]
FIGURE 4
FIGURE 4
Regional details of the statistical analysis. Summaries on both structural (Str) and functional (Func) analysis were shown in here. Areas with blue text indicate statistically significant result from the correlation analysis in contralateral hippocampal–neocortical connections. See Table 1 for abbreviations and their full name. [Color figure can be viewed in the online issue, which is available at wileyonlinelibrary.com.]
FIGURE 5
FIGURE 5
Analysis on resting functional connection between hippocampus and neocortical regions. Panel A shows hippocampal functional connection pattern in highest and lowest DRST-spatial test score monkeys, same monkeys shown in Figure 3B. Dominant hippocampal–neocortical connections are shown in red color while the gray and yellow color shows no or weak connections. Panel B shows the correlations analysis on the relationship between functional connection and DRST-spatial test. Statistically significant (P < 0.05 corrected) memory related structural connection loss are depicted in dark red (stronger functional connection in low performance) and blue (weaker functional connection in low performance) spheres. Panel C shows graphical plot of both functional and structural connection analysis. Left y-axes and red rectangles shows functional connectivity analysis and Right y-axes and blue cross shows structural connectivitiy analysis. Left hippocampus to left superior temporal sulcus area 2 gyral part is shown in the left, and right hippocampus to right parietal area POa external part (PoaE_R) is shown in the right side. [Color figure can be viewed in the online issue, which is available at wileyonlinelibrary.com.]

Similar articles

Cited by

References

    1. Anderson MJ, Robinson J. Permutation tests for linear models. Aust N Z J Stat. 2001;43:75–88.
    1. Barbas H, Blatt GJ. Topographically specific hippocampal projections target functionally distinct prefrontal areas in the rhesus monkey. Hippocampus. 1995;5:511–533. - PubMed
    1. Beason-Held LL, Rosene DL, Killiany RJ, Moss MB. Hippocampal formation lesions produce memory impairment in the rhesus monkey. Hippocampus. 1999;9:562–574. - PubMed
    1. Biswal B, Yetkin FZ, Haughton VM, Hyde JS. Functional connectivity in the motor cortex of resting human brain using echo-planar MRI. Magn Reson Med. 1995;34:537–541. - PubMed
    1. Bonnelle V, Leech R, Kinnunen KM, Ham TE, Beckmann CF, De Boissezon X, Greenwood RJ, Sharp DJ. Defaultmodenetworkconnectivity predicts sustained attention deficits following traumatic brain injury. J Neurosci. 2011;31:13442–13451. - PMC - PubMed

Publication types