Review
. 2013 Aug 15;19(16):4315-25.
doi: 10.1158/1078-0432.CCR-12-3937. Epub 2013 Jun 18.

Impact of bioinformatic procedures in the development and translation of high-throughput molecular classifiers in oncology

Affiliations
Review

Impact of bioinformatic procedures in the development and translation of high-throughput molecular classifiers in oncology

Charles Ferté et al. Clin Cancer Res. .

Abstract

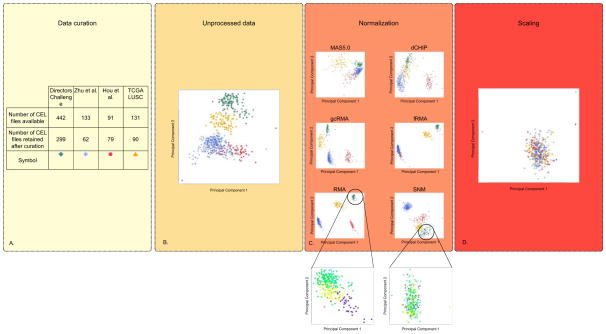
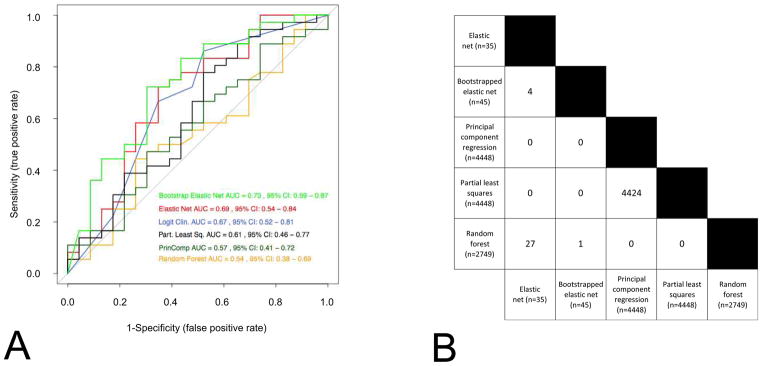
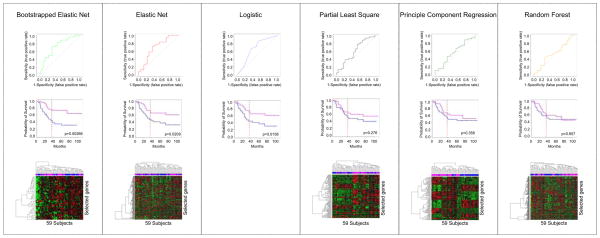
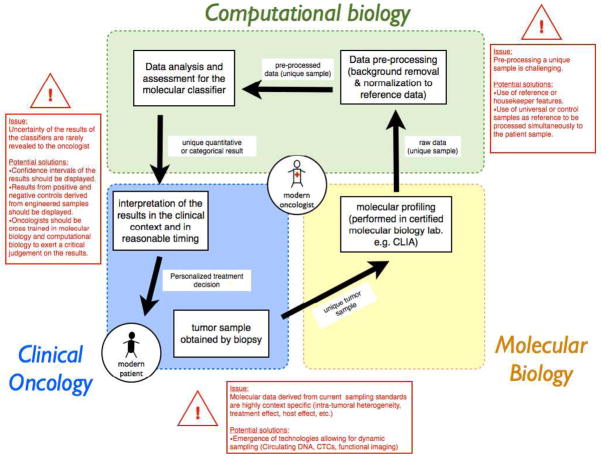
The progressive introduction of high-throughput molecular techniques in the clinic allows for the extensive and systematic exploration of multiple biologic layers of tumors. Molecular profiles and classifiers generated from these assays represent the foundation of what the National Academy describes as the future of "precision medicine". However, the analysis of such complex data requires the implementation of sophisticated bioinformatic and statistical procedures. It is critical that oncology practitioners be aware of the advantages and limitations of the methods used to generate classifiers to usher them into the clinic. This article uses publicly available expression data from patients with non-small cell lung cancer to first illustrate the challenges of experimental design and preprocessing of data before clinical application and highlights the challenges of high-dimensional statistical analysis. It provides a roadmap for the translation of such classifiers to clinical practice and makes key recommendations for good practice.


Conflict of interest statement

Disclosure of conflicts of interest: The authors declare that they have no competing financial interests.

Figures

Figure 1
Figure 1
Overview of the pre-processing framework. Effects on the structure of the data are represented by principle component plots for four NSCLC gene expression datasets processed separately. (A) A Table to represent the number of raw data (CEL files) included in study as a result of the data curation process. As the classifier is for early-stage patients, an explicit decision was made to only include those who are pathological stage IA to IIIA, who did not receive induction or adjuvant chemotherapy and patients for whom overall survival (OS) data are available. In addition, only patients who underwent complete tumor resection were included. Finally, gene expression outliers were identified graphically and removed from further analyses. (B) Unprocessed data analyzed by principal component analysis plot (C) Effect of five widely used unsupervised (RMA (Robust Multi-array Average) (71), gcRMA (GC Robust Multi-array Average) (72), MAS5.0 (Affymetrix Multiarray Suite 5.0) (73), dCHIP (DNA Chip Analyzer) (74) and fRMA (frozen Robust Multiarray Analysis) (75)) and one supervised (SNM) (14) normalization methods on the structure of the data. The effect of normalization on only the patients included in the Directors Challenge dataset are shown in the callouts from SNM and RMA with batch represented by different colors on principal component plot. (D) Principal component plot of SNM normalized data normalized to unit variance and 0 mean. The data and code to generate these plots are made available (see supplementary material).
Figure 2
Figure 2
Signatures developed using different methods have similar prediction performance (Panel A) and present very little consistency with each other (Panel B). (A) Receiver-operating characteristic curves of six widely used statistical methods (logistic regression, elastic net, bootstrapped elastic net, random forest, principal component regression and partial least square regression) in predicting the probability of 3 year OS. The Director’s challenge and the Zhu et al. datasets are used as training and validation set, respectively. The ROC AUC (receiving operating characteristic curves area under the curve) and their 95% confidence interval are computed for each method. Note that all curves overlap with one another. (B) The number of features selected with each method are presented, as well as the number of genes that overlap from each method. Note the very small overlap of features across the different models, confirming that multiple and different solutions (local optima) of a same problem may lead to similar prediction results.
Figure 3
Figure 3
Comparison of receiver-operating characteristic curves, Kaplan-Meier survival prediction and heatmaps for six commonly used statistical methods (bootstrapped elastic net, elastic net, logistic regression, partial least square regression, principle component regression and random forest) ordered by performance on ROC. Log-rank test is used to report p-value of the differences of good outcome and poor outcome groups (as defined by median) for Kaplan-Meier predictors. The patients included in each group in Kaplan-Meier analysis are coded in the unsupervised clustering among the validation dataset in each heatmap (magenta for good outcome, blue for poor outcome). Many clinicians and cancer biologists reading a molecular classifier paper will expect heatmaps and Kaplan-Meier curves, yet such figures are not optimal to evaluate the model performance. However, observing a significant difference in survival between the groups does not guarantee a significant performance of the model and a performant model does not guarantee true clustering of genes in the heatmaps. Notably, the ROC curves show performance differences, while the log-rank p values are less useful in this context. Furthermore, models that perform the best here (bootstrapped ElasticNet) do not exhibit marked structure in heatmaps, while poorly performing models (principle component regression) misleadingly exhibit sharper delineation of features in their heatmaps. The logistic regression analysis was performed on clinical covariates alone, and therefore no heatmaps of gene expression can be computed.
Figure 4
Figure 4
Challenges in the translation at bedside of a validated molecular classifier. Described are the steps taken by the modern oncologist when obtaining a prediction of a validated classifier for a single patient. Passing through these steps, particular problems and their potential solutions are highlighted in red boxes. To embrace precision medicine, the modern oncologist needs to develop or access competencies in molecular biology and in computational biology, in addition to clinical oncology.

References

    1. National Research Council of the National Academies. Toward Precision Medicine: Building a Knowledge Network for Biomedical Research and a New Taxonomy of Disease. 2011. - PubMed
    1. Ferté C, André F, Soria J-C. Molecular circuits of solid tumors: prognostic and predictive tools for bedside use. Nat Rev Clin Oncol. 2010;7:367–80. - PubMed
    1. Koscielny S. Why most gene expression signatures of tumors have not been useful in the clinic. Sci Transl Med. 2010;2:14ps2. - PubMed
    1. Subramanian J, Simon R. Gene expression-based prognostic signatures in lung cancer: ready for clinical use? J Natl Cancer Inst. 2010;102:464–74. - PMC - PubMed
    1. Mukherjee S, Tamayo P, Rogers S, Rifkin R, Engle A, Campbell C, et al. Estimating dataset size requirements for classifying DNA microarray data. J Comput Biol. 2003;10:119–42. - PubMed

Publication types

LinkOut - more resources