

Volumetric characterization of human coronary calcification by frequency-domain optical coherence tomography
- PMID: 23782524
- PMCID: PMC4422196
- DOI: 10.1253/circj.cj-12-1458
Volumetric characterization of human coronary calcification by frequency-domain optical coherence tomography
Abstract
Background: Coronary artery calcification (CAC) presents unique challenges for percutaneous coronary intervention. Calcium appears as a signal-poor region with well-defined borders by frequency-domain optical coherence tomography (FD-OCT). The objective of this study was to demonstrate the accuracy of intravascular FD-OCT to determine the distribution of CAC.
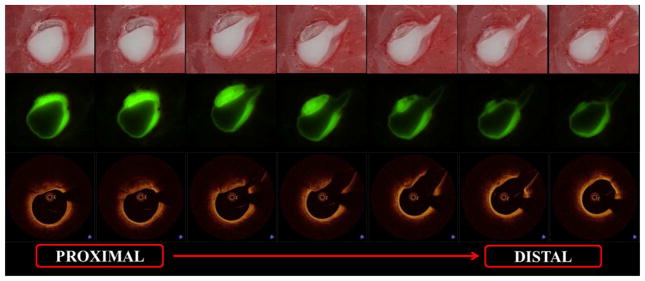
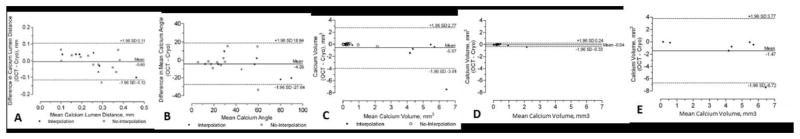
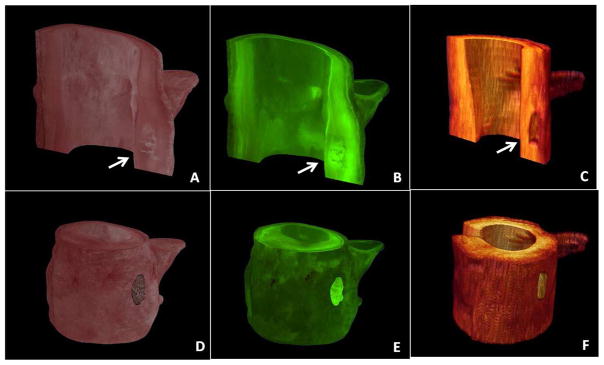
Methods and results: Cadaveric coronary arteries were imaged using FD-OCT at 100-μm frame interval. Arteries were subsequently frozen, sectioned and imaged at 20-μm intervals using the Case Cryo-Imaging automated system(TM). Full volumetric co-registration between FD-OCT and cryo-imaging was performed. Calcium area, calcium-lumen distance (depth) and calcium angle were traced on every cross-section; volumetric quantification was performed offline. In total, 30 left anterior descending arteries were imaged: 13 vessels had a total of 55 plaques with calcification by cryo-imaging; FD-OCT identified 47 (85%) of these plaques. A total of 1,285 cryo-images were analyzed and compared with corresponding co-registered 257 FD-OCT images. Calcium distribution, represented by the mean depth and the mean calcium angle, was similar, with excellent correlation between FD-OCT and cryo-imaging respectively (mean depth: 0.25±0.09 vs. 0.26±0.12mm, P=0.742; R=0.90), (mean angle: 35.33±21.86° vs. 39.68±26.61°, P=0.207; R=0.90). Calcium volume was underestimated in large calcifications (3.11±2.14 vs. 4.58±3.39mm(3), P=0.001) in OCT vs. cryo respectively.
Conclusions: Intravascular FD-OCT can accurately characterize CAC distribution. OCT can quantify absolute calcium volume, but may underestimate calcium burden in large plaques with poorly defined abluminal borders.
Figures


References
-
- Budoff MJ, Hokanson JE, Nasir K, et al. Progression of coronary artery calcium predicts all-cause mortality. JACC Cardiovasc Imaging. 2010;3:1229–36. - PubMed
-
- Graham G, Blaha MJ, Budoff MJ, et al. Impact of coronary artery calcification on all-cause mortality in individuals with and without hypertension. Atherosclerosis. 2012 - PubMed
-
- Kondos GT, Hoff JA, Sevrukov A, et al. Electron-beam tomography coronary artery calcium and cardiac events: a 37-month follow-up of 5635 initially asymptomatic low- to intermediate-risk adults. Circulation. 2003;107:2571–6. - PubMed
-
- Fitzgerald PJ, Ports TA, Yock PG. Contribution of localized calcium deposits to dissection after angioplasty. An observational study using intravascular ultrasound. Circulation. 1992;86:64–70. - PubMed
-
- Shimony A, Zahger D, Van Straten M, et al. Incidence, risk factors, management and outcomes of coronary artery perforation during percutaneous coronary intervention. Am J Cardiol. 2009;104:1674–7. - PubMed
Publication types
MeSH terms
Substances
Grants and funding
LinkOut - more resources
Full Text Sources
Other Literature Sources
Medical