

Comprehensive identification of proteins from MALDI imaging
- PMID: 23782541
- PMCID: PMC3790299
- DOI: 10.1074/mcp.M113.027599
Comprehensive identification of proteins from MALDI imaging
Abstract
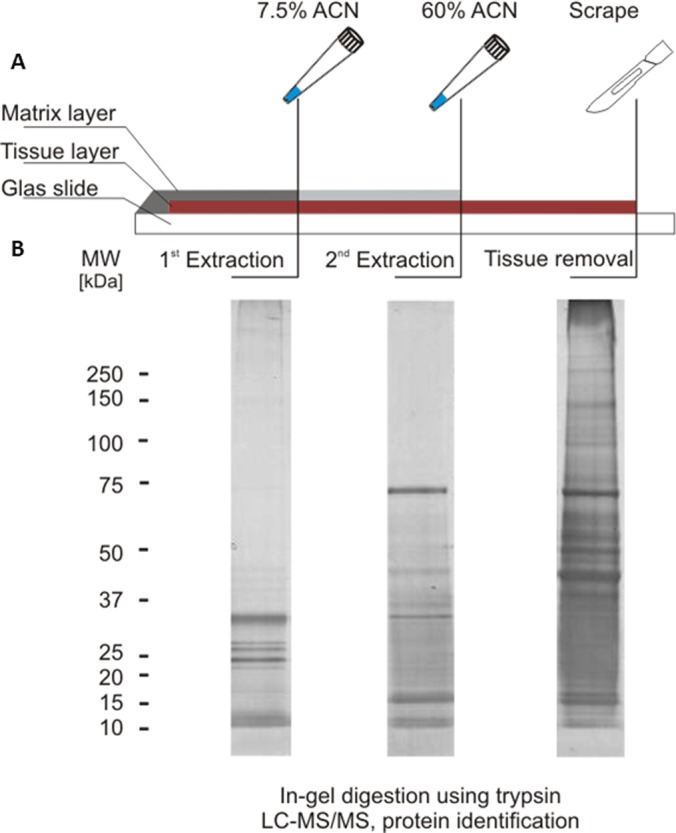
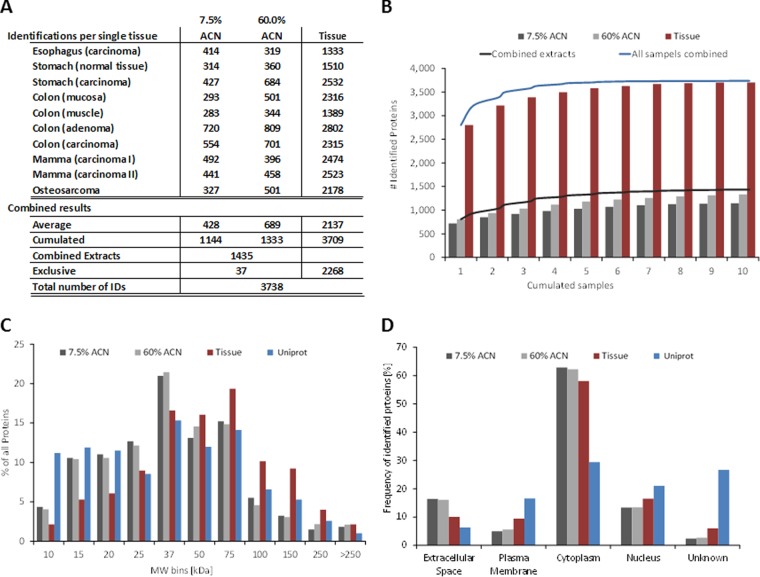
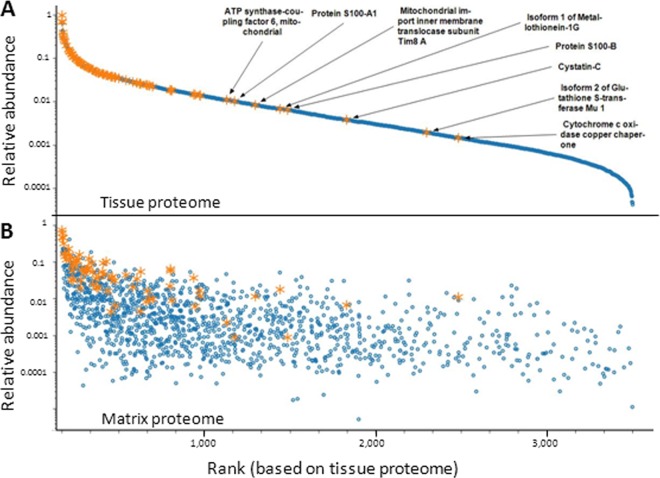
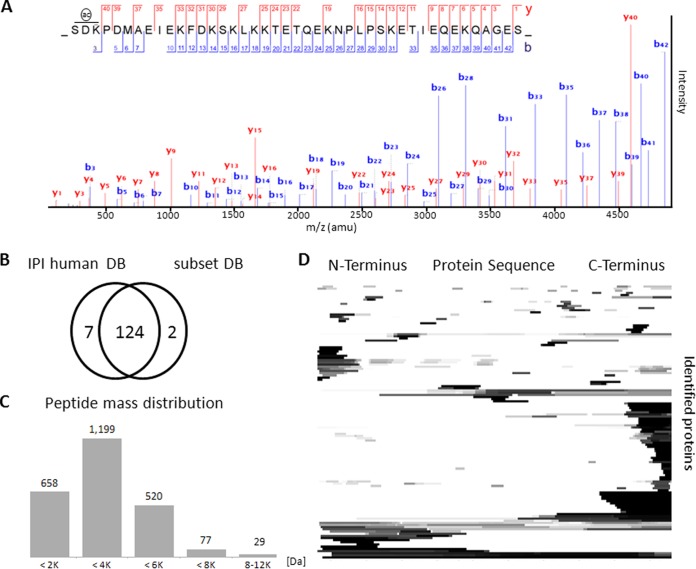
Matrix-assisted laser desorption/ionization imaging mass spectrometry (MALDI IMS) is a powerful tool for the visualization of proteins in tissues and has demonstrated considerable diagnostic and prognostic value. One main challenge is that the molecular identity of such potential biomarkers mostly remains unknown. We introduce a generic method that removes this issue by systematically identifying the proteins embedded in the MALDI matrix using a combination of bottom-up and top-down proteomics. The analyses of ten human tissues lead to the identification of 1400 abundant and soluble proteins constituting the set of proteins detectable by MALDI IMS including >90% of all IMS biomarkers reported in the literature. Top-down analysis of the matrix proteome identified 124 mostly N- and C-terminally fragmented proteins indicating considerable protein processing activity in tissues. All protein identification data from this study as well as the IMS literature has been deposited into MaTisse, a new publically available database, which we anticipate will become a valuable resource for the IMS community.
Figures
References
-
- Balluff B., Schöne C., Höfler H., Walch A. (2011) MALDI imaging mass spectrometry for direct tissue analysis: technological advancements and recent applications. Histochem. Cell Biol. 136, 227–244 - PubMed
-
- Caprioli R. M., Farmer T. B., Gile J. (1997) Molecular imaging of biological samples: localization of peptides and proteins using MALDI-TOF MS. Anal. Chem. 69, 4751–4760 - PubMed
-
- Römpp A., Guenther S., Takats Z., Spengler B. (2011) Mass spectrometry imaging with high resolution in mass and space (HR(2) MSI) for reliable investigation of drug compound distributions on the cellular level. Anal. Bioanal. Chem. 401, 65–73 - PubMed
-
- Signor L., Varesio E., Staack R. F., Starke V., Richter W. F., Hopfgartner G. (2007) Analysis of erlotinib and its metabolites in rat tissue sections by MALDI quadrupole time-of-flight mass spectrometry. J. Mass Spectrom. 42, 900–909 - PubMed
-
- Liu Y., Chen Y., Momin A., Shaner R., Wang E., Bowen N. J., Matyunina L. V., Walker L. D., McDonald J. F., Sullards M. C., Merrill A. H., Jr (2010) Elevation of sulfatides in ovarian cancer: an integrated transcriptomic and lipidomic analysis including tissue-imaging mass spectrometry. Mol. Cancer 9, 186. - PMC - PubMed
Publication types
MeSH terms
Substances
LinkOut - more resources
Full Text Sources
Other Literature Sources
Molecular Biology Databases
