. 2013 Aug 2;288(31):22506-15.
doi: 10.1074/jbc.M113.477810. Epub 2013 Jun 19.

Modulating the intrinsic disorder in the cytoplasmic domain alters the biological activity of the N-methyl-D-aspartate-sensitive glutamate receptor

Affiliations

Modulating the intrinsic disorder in the cytoplasmic domain alters the biological activity of the N-methyl-D-aspartate-sensitive glutamate receptor

Ucheor B Choi et al. J Biol Chem. .

Abstract

The NMDA-sensitive glutamate receptor is a ligand-gated ion channel that mediates excitatory synaptic transmission in the nervous system. Extracellular zinc allosterically regulates the NMDA receptor by binding to the extracellular N-terminal domain, which inhibits channel gating. Phosphorylation of the intrinsically disordered intracellular C-terminal domain alleviates inhibition by extracellular zinc. The mechanism for this functional effect is largely unknown. Proline is a hallmark of intrinsic disorder, so we used proline mutagenesis to modulate disorder in the cytoplasmic domain. Proline depletion selectively uncoupled zinc inhibition with little effect on receptor biogenesis, surface trafficking, or ligand-activated gating. Proline depletion also reduced the affinity for a PDZ domain involved in synaptic trafficking and affected small molecule binding. To understand the origin of these phenomena, we used single molecule fluorescence and ensemble biophysical methods to characterize the structural effects of proline mutagenesis. Proline depletion did not eliminate intrinsic disorder, but the underlying conformational dynamics were changed. Thus, we altered the form of intrinsic disorder, which appears sufficient to affect the biological activity. These findings suggest that conformational dynamics within the intrinsically disordered cytoplasmic domain are important for the allosteric regulation of NMDA receptor gating.

Keywords: Electrophysiology; Fluorescence Resonance Energy Transfer (FRET); Glutamate Receptors Ionotropic (AMPA, NMDA); Intrinsically Disordered Proteins; Single Molecule Biophysics.


Figures

FIGURE 1.
FIGURE 1.
Prediction of intrinsic disorder and aggregation propensity of the GluN2B cytoplasmic domain. A, fractional difference in amino acid composition of the GluN2B CTD relative to ordered proteins. For each amino acid compositional profiles are shown (in order) for typical disordered proteins from the DisProt database (black), the whole CTD (white), along with a separate profile for CTD2 (yellow). Data for each amino acid begins with the black bar and ends with the yellow bar. Cx is the content of a given amino acid in the query, and Corder is the content in fully ordered proteins. B, PONDR VL-XT profiles of the wild type CTD2 (black) and the effect of proline-to-alanine (red) and proline-to-serine (blue) mutations. C, per residue aggregation propensities for wild type CTD2 (black) along with the alanine- (red), and serine- (blue) proline-depleted mutants.
FIGURE 2.
FIGURE 2.
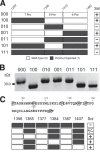
Solubility of proline depletion constructs. A, CTD2 was divided into three regions. The total number of proline residues within each region is indicated in the top row. The designation for each construct is shown to the left. Filled bars indicate that all prolines in the region were replaced by alanine. The solubility of recombinant proteins after lysis in physiological buffer is indicated next to each construct as soluble (+) and insoluble (−), respectively. B, change in electrophoretic mobility due to proline depletion. The region of proline depletion for each sample is denoted above each lane. C, effect on solubility of individual proline depletions in the central region of CTD2. Sequence of the central region shows the individual proline residues (boxes). Filled bars indicate individual proline residues replaced by alanine. Solubility is indicated next to each construct.
FIGURE 3.
FIGURE 3.
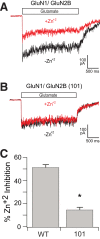
Proline depletion uncouples allosteric regulation of GluN2B by zinc. Representative whole-cell current traces for HEK cells expressing either GluN1/GluN2B (A) or GluN1/GluN2B(101) (B). Currents for wild type and mutant channels were recorded in the absence (black) or presence (red) of 1 μm ZnCl2. Glycine was included in all solutions at 0.1 mm. Holding potential was −70 mV. Glutamate (open bar) was applied at 1 mm for 2.5 s using a piezo-driven application system (see “Experimental Procedures”). C, average percent inhibition (± S.E.) of peak whole-cell currents by 1 μm ZnCl2. * indicates values statistically different from GluN1/GluN2B (p < 0.05, Student's t test). Number of recordings: GluN1/GluN2B, 7; GluN1/GluN2B(101), 10.
FIGURE 4.
FIGURE 4.
Modulating intrinsic disorder affects PDZ interactions and small molecule binding. A, schematic depicting the smFRET protein binding assay. CTD2 is biotinylated on the N terminus and surface-immobilized through biotin-streptavidin interactions on a passivated surface. CTD2 is labeled with an acceptor dye 23 residues away from the C-terminal PDZ ligand. The PDZ2 domain from PSD-95 is labeled with a donor dye and added in solution above the bilayer. B, representative data showing individual protein binding events used for the measurement of dwell times. The presence of acceptor intensity defines the bound state. Gaps between binding events define the unbound state. A.U., arbitrary units. C, rate constants for PDZ2 binding (koff; left axis, filled circles) and unbinding (kon; right axis, open circles). Construct 001 is proline depleted in the region preceding the PDZ-binding site. Phosphorylation with Src kinase is indicated above the panel. Data are presented as mean ± S.E. * indicates values statistically different from both proline-depleted and phosphorylated CTD2 (p < 0.05, Student's t test). D, fluorescence emission spectra of bis-ANS in the presence of CTD2 and the proline-free constructs. Spectra were collected using 1 μm bis-ANS with 0.1 μm protein. Protein-free buffer (yellow); wild type CTD2 (orange); Chimera 100 (red); Chimera 001 (blue), Chimera 101 (purple).
FIGURE 5.
FIGURE 5.
Conformational effects of proline depletion. A, changes in analytical size exclusion chromatography of CTD2 upon proline depletion. Data are plotted as hydrodynamic radius (RH) (left axis, filled circles). RH was determined from the apparent molecular weight in reference to globular protein standards (21). For reference, data are also plotted as elution time normalized by the void volume of the column (Ve/V0) (right axis, open circles). B, circular dichroism spectra for WT CTD2 (solid circles) along with soluble proline-depleted CTD2 constructs 100 (open circles), 001 (open squares), and 101 (open triangles). C, limited proteolysis of wild type (left column) and the proline-depleted construct 101 (middle column). Equal concentrations of both proteins were used in the reaction. The graph (right column) shows the kinetics of the disappearance of the full-length protein. The mean intensity at the position of full-length CTD2 was determined using ImageJ for wild type (red) and 101 (black). Lines show the fit to a mono-exponential decay. The top row shows proteolysis by trypsin. The bottom row shows proteolysis by chymotrypsin. At the indicated time points, a sample of the reaction was removed and inhibited to stop further degradation. Molecular mass markers are indicated to the left of the panel.
FIGURE 6.
FIGURE 6.
Single molecule FRET measurements of conformation and dynamics. A, representative data for a CTD2 molecule undergoing stochastic FRET transitions. Bar above the panel shows the sequence of laser illumination used to identify acceptor fluorophores (red) and excite donor fluorophores for the measurement of FRET (green). Panel shows acceptor (magenta) and donor (cyan) emission over time. The acceptor photobleaches at 12 s with an anticorrelated increase in donor fluorescence followed by donor photobleaching at 20 s. A.U., arbitrary units. B, fraction of single molecules that showed stochastic FRET transitions. The construct measured is indicated below each bar. Data are presented as mean ± S.E. * indicates significant difference from wild type (p value < 0.05, two-tailed t test). C, histogram of all FRET states visited by CTD2 molecules. The histogram contains both static and dynamic molecules. Constructs: wild type (black); 100 (red); 010 (brown); 001 (blue); 011 (purple); 101 (dashed line). D, conformational effects of Src phosphorylation on the proline-depleted construct 101. Protein was doubly labeled with donor and acceptor dye and phosphorylated by Src kinase in solution before encapsulation. Histogram shows all FRET values sampled by individual molecules confirmed to have a single donor-acceptor pair. As with the wild type protein (19), there is a shift to lower FRET values upon phosphorylation.

References

    1. Traynelis S. F., Wollmuth L. P., McBain C. J., Menniti F. S., Vance K. M., Ogden K. K., Hansen K. B., Yuan H., Myers S. J., Dingledine R. (2010) Glutamate receptor ion channels: structure, regulation, and function. Pharmacol. Rev. 62, 405–496 - PMC - PubMed
    1. Lau C. G., Zukin R. S. (2007) NMDA receptor trafficking in synaptic plasticity and neuropsychiatric disorders. Nat. Rev. Neurosci. 8, 413–426 - PubMed
    1. Ryan T. J., Kopanitsa M. V., Indersmitten T., Nithianantharajah J., Afinowi N. O., Pettit C., Stanford L. E., Sprengel R., Saksida L. M., Bussey T. J., O'Dell T. J., Grant S. G., Komiyama N. H. (2013) Evolution of GluN2A/B cytoplasmic domains diversified vertebrate synaptic plasticity and behavior. Nat. Neurosci. 16, 25–32 - PMC - PubMed
    1. Sprengel R., Suchanek B., Amico C., Brusa R., Burnashev N., Rozov A., Hvalby O., Jensen V., Paulsen O., Andersen P., Kim J. J., Thompson R. F., Sun W., Webster L. C., Grant S. G., Eilers J., Konnerth A., Li J., McNamara J. O., Seeburg P. H. (1998) Importance of the intracellular domain of NR2 subunits for NMDA receptor function in vivo. Cell 92, 279–289 - PubMed
    1. Rachline J., Perin-Dureau F., Le Goff A., Neyton J., Paoletti P. (2005) The micromolar zinc-binding domain on the NMDA receptor subunit NR2B. J. Neurosci. 25, 308–317 - PMC - PubMed

Publication types

Substances

LinkOut - more resources