. 2013 Sep;154(9):3031-42.
doi: 10.1210/en.2012-2195. Epub 2013 Jun 19.

Mammary-specific ablation of the calcium-sensing receptor during lactation alters maternal calcium metabolism, milk calcium transport, and neonatal calcium accrual

Affiliations

Mammary-specific ablation of the calcium-sensing receptor during lactation alters maternal calcium metabolism, milk calcium transport, and neonatal calcium accrual

Ramanaiah Mamillapalli et al. Endocrinology. 2013 Sep.

Abstract

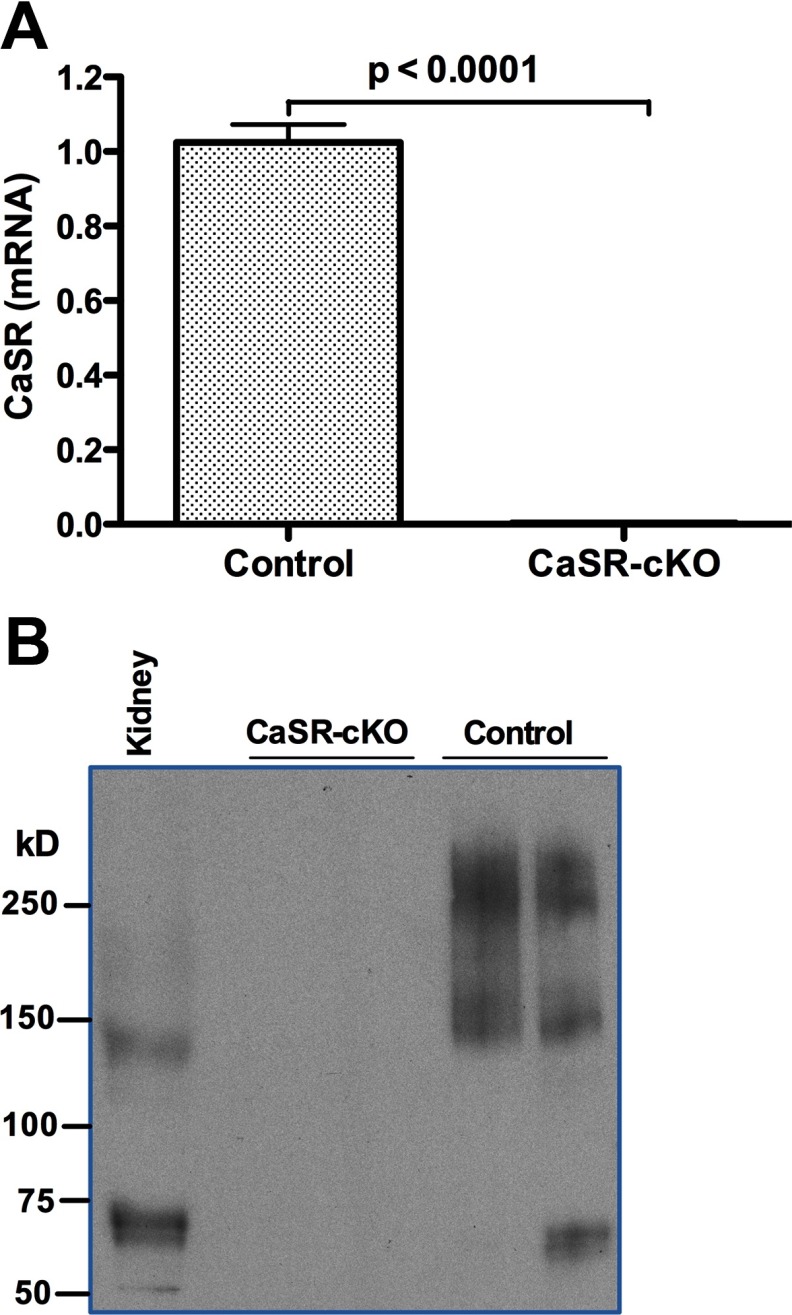
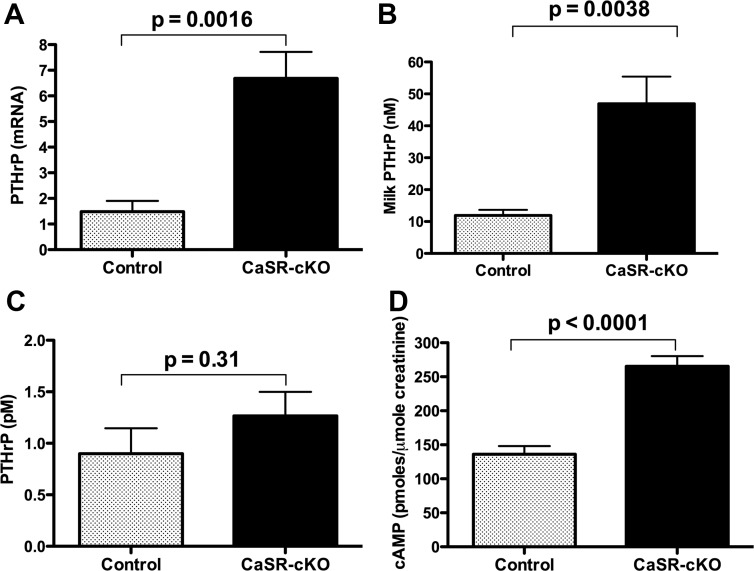
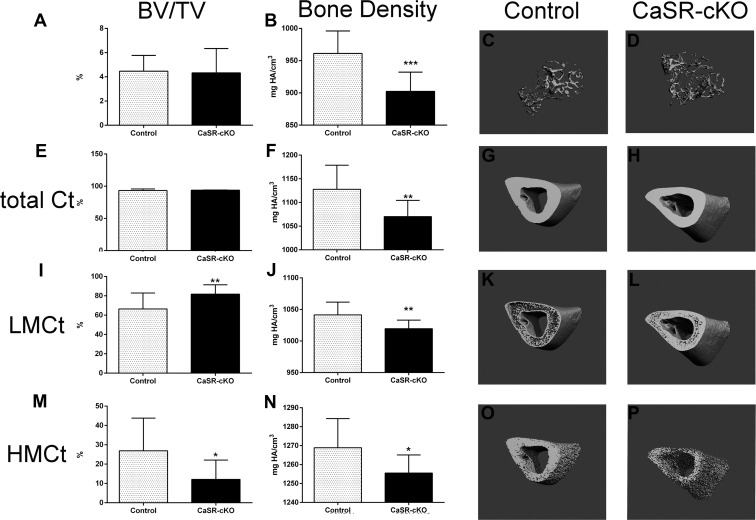
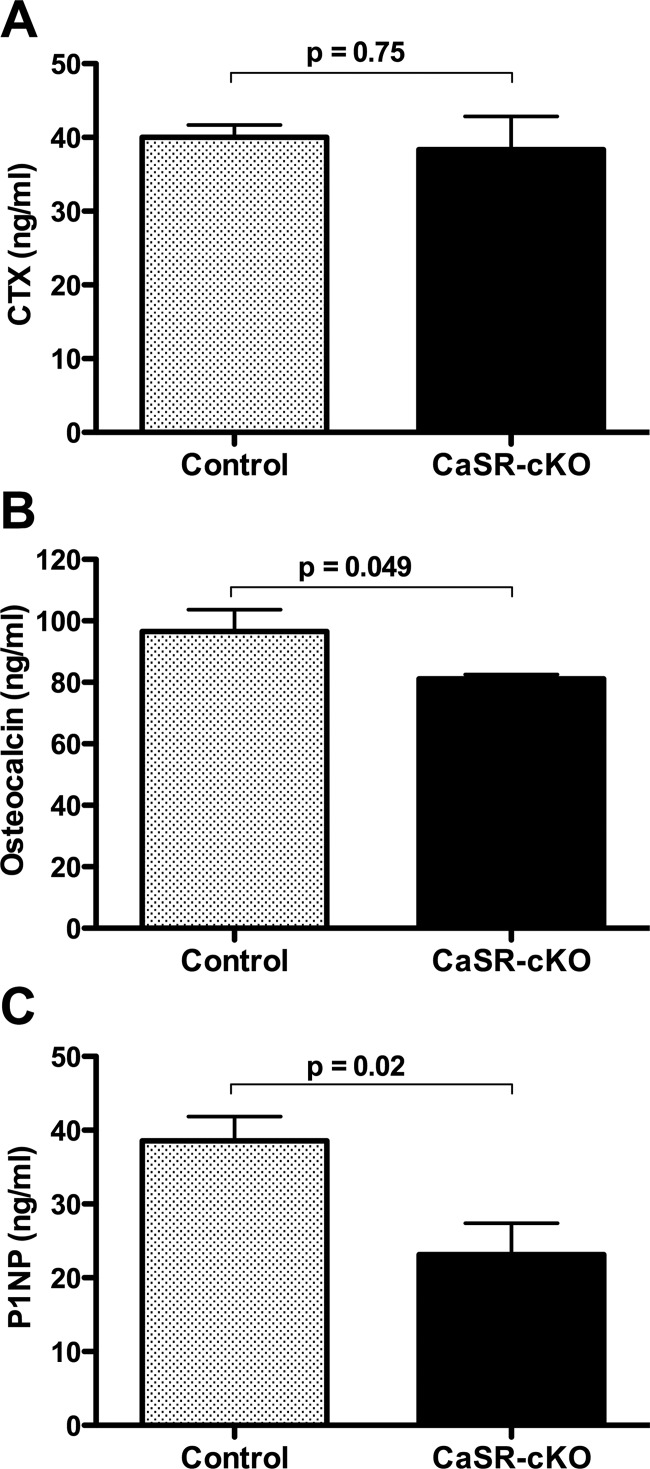
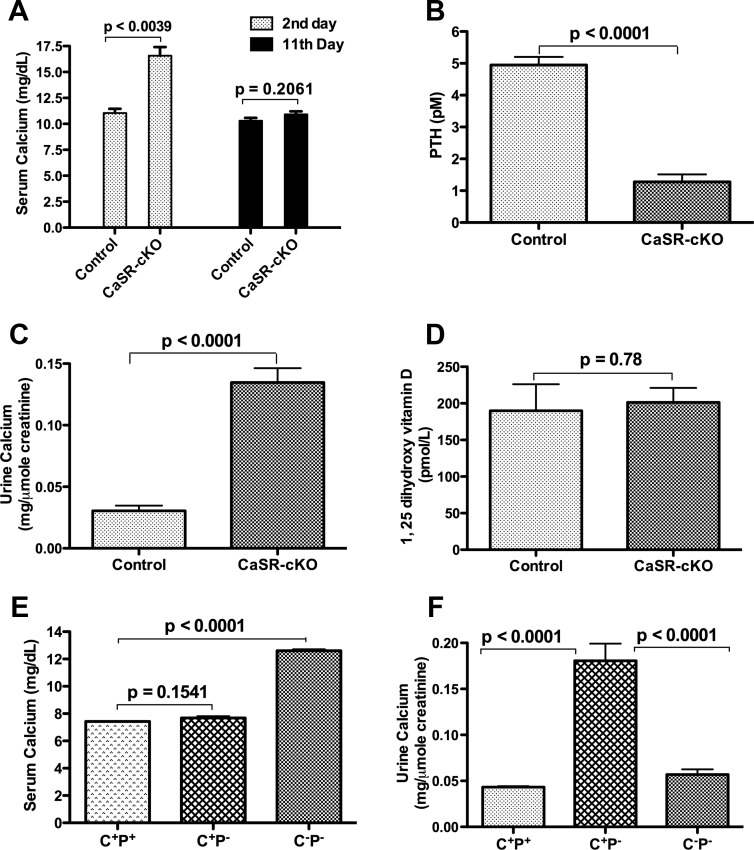
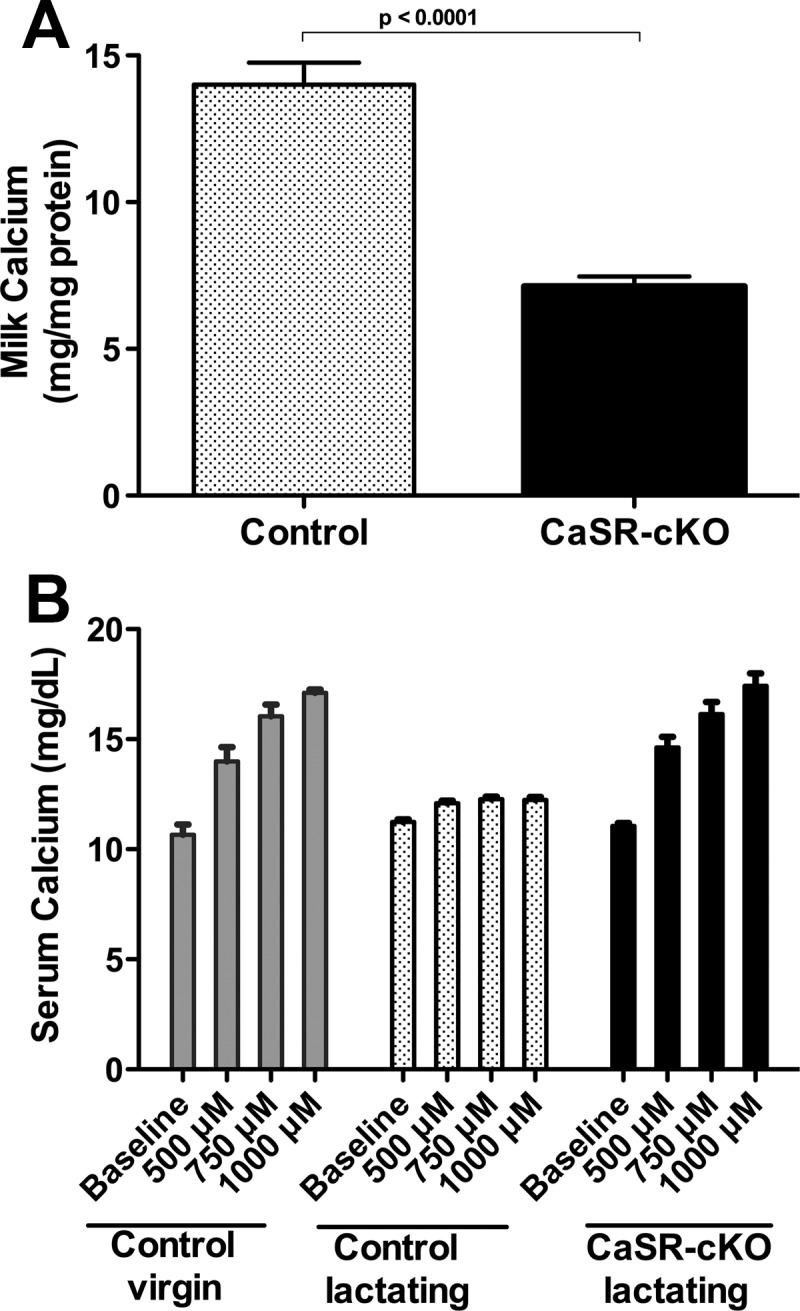
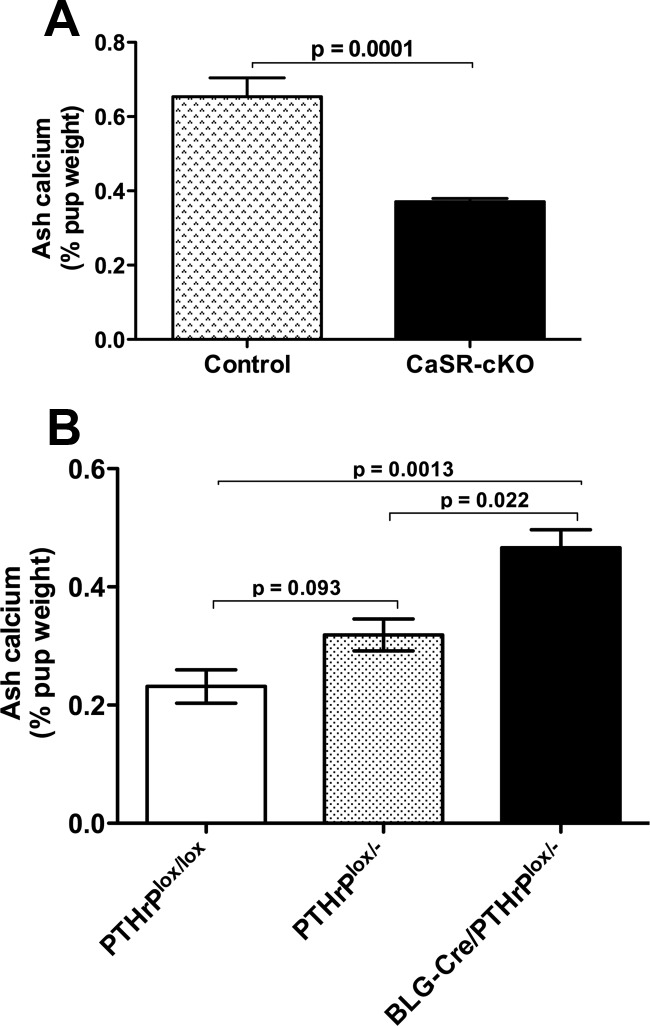
To meet the demands for milk calcium, the lactating mother adjusts systemic calcium and bone metabolism by increasing dietary calcium intake, increasing bone resorption, and reducing renal calcium excretion. As part of this adaptation, the lactating mammary gland secretes PTHrP into the maternal circulation to increase bone turnover and mobilize skeletal calcium stores. Previous data have suggested that, during lactation, the breast relies on the calcium-sensing receptor (CaSR) to coordinate PTHrP secretion and milk calcium transport with calcium availability. To test this idea genetically, we bred BLG-Cre mice with CaSR-floxed mice to ablate the CaSR specifically from mammary epithelial cells only at the onset of lactation (CaSR-cKO mice). Loss of the CaSR in the lactating mammary gland did not disrupt alveolar differentiation or milk production. However, it did increase the secretion of PTHrP into milk and decreased the transport of calcium from the circulation into milk. CaSR-cKO mice did not show accelerated bone resorption, but they did have a decrease in bone formation. Loss of the mammary gland CaSR resulted in hypercalcemia, decreased PTH secretion, and increased renal calcium excretion in lactating mothers. Finally, loss of the mammary gland CaSR resulted in decreased calcium accrual by suckling neonates, likely due to the combination of increased milk PTHrP and decreased milk calcium. These results demonstrate that the mammary gland CaSR coordinates maternal bone and calcium metabolism, calcium transport into milk, and neonatal calcium accrual during lactation.


Figures

Figure 1.
Figure 1.
Loss of CaSR mRNA and protein during lactation in CaSR-cKO mice. A, Quantitative PCR for CaSR mRNA expression in control (CaSRlox/lox) and CaSR-cKO (BLG-Cre;CaSRlox/lox) mammary glands. Note the almost complete loss of CaSR expression in lactating mammary glands in the cKO mice. Bars represent the mean and SEM of 7 mice for each genotype. B, Western blots for CaSR expression in membrane extracts from kidneys and CaSR-cKO and control mammary glands run under nonreducing conditions. The predominant forms of the CaSR in mammary gland membranes appear to be multimers with molecular masses of approximately 160 and 250 kDa. There was no immunoreactive CaSR protein detected in membranes from cKO mammary glands. Kidney expressed CaSR isoforms predominantly of approximately 65 and of 140 kDa.
Figure 2.
Figure 2.
Loss of the CaSR increases PTHrP production by the mammary gland. A, PTHrP mRNA levels in lactating mammary glands as measured by quantitative PCR. Bars represent the mean ± SEM for 6 mice of each genotype. B, Immunoreactive PTHrP levels measured in milk harvested from control and CaSR-cKO dams. Bars represent the mean ± SEM for 5 mice of each genotype. C, Circulating plasma immunoreactive PTHrP levels in control and CaSR-cKO mice on day 12 of lactation. Bars represent the mean ± SEM for 6 mice of each genotype. D, Urinary cAMP concentrations corrected for creatinine excretion in control and CaSR-cKO mice on day 12 of lactation. Bars represent the mean ± SEM for 13 mice of each genotype.
Figure 3.
Figure 3.
Micro-CT results for CaSR-cKO and control mice. A–D, Trabecular micro-CT results. A, Results for bone mass as measured by BV/TV. There is no difference between the CaSR-cKO and control mice. B, Results for BMD in CaSR-cKO and control mice. Note that BMD is significantly reduced in the CaSR-cKO bones. C and D, Three-dimensional reconstructions of trabecular bone from the proximal tibia of control and CaSR-cKO lactating mice. E–P, Cortical micro-CT results. E, Results for overall cortical bone mass (micro-CT threshold 350–1000) as measured by BV/TV. There is no difference between the CaSR-cKO and control mice. F, Results for cortical BMD in CaSR-cKO and control mice. Note that BMD is significantly reduced in the CaSR-cKO bones. G and H, Three-dimensional reconstructions of representative cortical bone from the tibia of control and CaSR-cKO lactating mice. I, Results for low-mineral-density (micro-CT threshold 350–630) cortical bone mass (Bv/TV). There is an increase in low-mineral-density bone in the CaSR-cKO mice. J, Results for BMD of low-density bone in CaSR-cKO and control mice. BMD is significantly reduced in the CaSR-cKO bones. K and L, Three-dimensional reconstructions of representative low-mineral-density bone in the tibial cortex of control and CaSR-cKO lactating mice. In controls the low-mineral-density bone is located mostly at the endosteal and periosteal surfaces, but in the CaSR-cKO mice, it is more evenly distributed throughout the entire cortex. M, Results for high-mineral-density (micro-CT threshold 630–1000) cortical bone mass (Bv/TV). There is a decrease in high-mineral-density bone in the CaSR-cKO mice. N, Results for BMD of high-mineral-density bone in CaSR-cKO and control mice. BMD is significantly reduced in the CaSR-cKO bones. O and P, Three-dimensional reconstructions of representative high-density bone in the tibial cortex of control and CaSR-cKO lactating mice. There is a clear and uniform reduction in high-mineral-density bone throughout the cortex. In all instances, values represent the means ± SEM for 12 controls and 9 CaSR-cKO mice. *, P < .05; **, P < .01; ***, P < .001.
Figure 4.
Figure 4.
Loss of the mammary gland CaSR reduces biochemical indices of bone formation but does not increase biochemical markers of bone resorption during lactation. A, Results for serum CTX in control and CaSR-cKO mice on day 12 of lactation. There was no significant increase in rates of bone resorption in CaSR-cKO mice. Bars represent the mean ± SEM for 6 mice of each genotype. B, Serum osteocalcin levels in control and CaSR-cKO mice on day 12 of lactation. There was a significant decrease in circulating osteocalcin levels in cKO as compared with control mice. Bars represent the mean ± SEM for 6 mice of each genotype. C, Serum P1NP levels in control and CaSR-cKO mice on day 12 of lactation. There was a significant decrease in circulating P1NP levels in cKO as compared with control mice. Bars represent the mean ± SEM for 4 control mice and 6 CaSR-cKO mice.
Figure 5.
Figure 5.
Loss of the mammary CaSR alters maternal calcium homeostasis during lactation. A, Serum calcium in control and CaSR-cKO mice on days 2 and 11 of lactation. The CaSR-cKO mice are transiently hypercalcemic in early lactation. Bars represent the mean ± SEM for 7 mice of each genotype. B, Circulating PTH levels in control and CaSR-cKO mice on day 12 of lactation. PTH levels are suppressed in lactating cKO mice. Bars represent the mean ± SEM for 7 mice of each genotype. C, Urinary calcium levels corrected for creatinine in control and CaSR-cKO mice on day 12 of lactation. Urinary calcium excretion is increased in lactating cKO mice. Bars represent the mean ± SEM for 13 mice of each genotype. D, 1,25 Dihydroxyvitamin D levels in control and CaSR-cKO mice on day 12 of lactation. Vitamin D levels were unchanged in lactating CaSR-cKO mice. Bars represent the mean ± SEM for 6 mice of each genotype. E, Serum calcium in rescued CaSR−/− mice on day 12 of lactation. C+P+ represents WT controls; C+P represents PTH−/− mice; and CP represents CaSR−/−;PTH−/− mice. Note the persistent hypercalcemia in the CP cohort. Bars represent the mean ± SEM for 5 mice of each genotype. F, Urinary calcium corrected for creatinine in rescued CaSR−/− mice on day 12 of lactation. Note that relative to C+P+ mice, urinary calcium levels are increased in C+P mice but not in CP mice. Bars represent the mean ± SEM for 5 mice of each genotype.
Figure 6.
Figure 6.
Loss of the mammary CaSR inhibits calcium transport into milk and clearance of calcium from the circulation in lactating mice. A, Milk calcium concentrations in control and CaSR-cKO mice on day 12 of lactation. Milk calcium is reduced in CaSR-cKO mice. Bars represent the mean ± SEM for 5 mice of each genotype. B, Shown are the serum calcium levels measured 30 minutes after IP calcium doses in control virgin mice, control lactating mice, and CaSR-cKO mice. In virgin mice, the administration of increasing doses of ip calcium results in progressive hypercalcemia. However, in lactating controls, calcium is quickly cleared from the circulation. Loss of the mammary CaSR impairs calcium clearance and reverts the lactating pattern back to that of a virgin mouse, demonstrating that the enhanced calcium clearance during lactation depends on the CaSR in the mammary gland. Bars represent the mean ± SEM for 3 mice of each genotype at each dose of ip calcium.
Figure 7.
Figure 7.
Loss of the mammary CaSR impairs neonatal calcium accrual. A, Ash calcium content expressed as the percentage of wet pup weight for pups suckling on control or CaSR-cKO dams. Note that total body calcium content is reduced for pups consuming milk from the CaSR-cKO mothers. Bars represent the mean ± SEM for the pups from 8 mothers of each genotype. B, Ash calcium content of pups suckling on PTHrPlox/lox, PTHrP lox/−, and BLG-Cre;PTHrPlox/− dams. Note that there is a dose-responsive increase in total body calcium content of the pups as the PTHrP levels in milk decline. Bars represent the mean ± SEM for the pups from 6 mothers of each genotype.

References

    1. Kovacs CS. Calcium and bone metabolism during pregnancy and lactation. J Mamm Gland Biol Neoplasia. 2005;10(2):105–118 - PubMed
    1. Kovacs CS, Kronenberg HM. Maternal-fetal calcium and bone metabolism during pregnancy, puerperium, and lactation. Endocr Rev. 1997;18(6):832–872 - PubMed
    1. VanHouten J. Maternal calcium and bone metabolism during lactation. Curr Opin Endocrinol Diabetes. 2005;12:477–482
    1. Wysolmerski JJ. Interactions between breast, bone, and brain regulate mineral and skeletal metabolism during lactation. Ann NY Acad Sci. 2010;1192:161–169 - PMC - PubMed
    1. VanHouten JN, Dann P, Stewart AF, et al. Mammary-specific deletion of parathyroid hormone-related protein preserves bone mass during lactation. J Clin Invest. 2003;112(9):1429–1436 - PMC - PubMed

Publication types

MeSH terms