. 2013 Jun 27;498(7455):449-55.
doi: 10.1038/nature12266. Epub 2013 Jun 19.

Combinatorial temporal patterning in progenitors expands neural diversity

Affiliations

Combinatorial temporal patterning in progenitors expands neural diversity

Omer Ali Bayraktar et al. Nature. .

Abstract

Human outer subventricular zone (OSVZ) neural progenitors and Drosophila type II neuroblasts both generate intermediate neural progenitors (INPs) that populate the adult cerebral cortex or central complex, respectively. It is unknown whether INPs simply expand or also diversify neural cell types. Here we show that Drosophila INPs sequentially generate distinct neural subtypes, that INPs sequentially express Dichaete, Grainy head and Eyeless transcription factors, and that these transcription factors are required for the production of distinct neural subtypes. Moreover, parental type II neuroblasts also sequentially express transcription factors and generate different neuronal/glial progeny over time, providing a second temporal identity axis. We conclude that neuroblast and INP temporal patterning axes act together to generate increased neural diversity within the adult central complex; OSVZ progenitors may use similar mechanisms to increase neural diversity in the human brain.


Figures
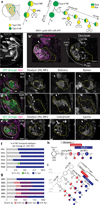
Fig 1
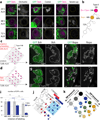
Fig 1. INPs sequentially express candidate temporal identity factors
a, Position of type II NBs (left). Cell lineage of type I and II NBs (right). iINP, immature INP. n, neurons. b, Type II NB lineages in one brain lobe, z-projection, R9D11-gal4 UAS-cd8::GFP. b’, High magnification view of the DM3 lineage showing the parental NB (Dpn+GFP−, arrowhead), the smaller INPs (Dpn+GFP+), and GMCs/neurons (Dpn− GFP+). Yellow line surrounds GFP+ cells. c–e, Dichaete marks young INPs and Eyeless marks old INPs; DM3 lineage shown. R9D11-gal4 UAS-cd8::GFP marks INPs and their progeny (yellow line). (e) Quantification. n=6 brains, lineages in a single lobe counted, percentages per each lineage were averaged. f–g, Grainyhead marks middle-aged INPs, which include the oldest Dichaete+ INPs and the youngest Eyeless+ INPs; DM3 lineage shown. R9D11-gal4 UAS-cd8::GFP marks INPs and their progeny (yellow line) and Grainyhead+ cells (white line). In addition, Grh+ GFP− immature INPs are observed between the parental NB and the GFP+ INP pool. (g) Quantification as in e. h,i, Summary of Dichaete, Grainyhead, and Eyeless sequential expression in INPs. Gal4 lines expressed in INPs are indicated. Scale bars, 10 µm.
Fig 2
Fig 2. Cross-regulation between INP temporal transcription factors
INP temporal transcription factor expression in DM2 lineage at 120h ALH. INPs were marked with GFP (yellow outline) driven by: wor-gal4 ase-gal80 (a,c), R9D11-gal4 (e,i), or R12E09D-gal4 (g). See supplemental methods for full genotypes. Ey border, white line. The parental type II NBs, arrowhead, or asterisk when out of focal plane. a–b, Wild type expression of Grh and Ey in INPs. c–d, DRNAi delays Grh expression in INPs, such that no Grh+Ey− INPs are observed. For Ey see Sup Fig. 4a,b. (d) Quantification of Ey+ and Grh+Ey− INP numbers (n=6). e–f, GrhRNAi extends D expression and delays Ey expression in INPs. (f) Quantification (n≥5). g–h, EyRNAi extends Grh expression in INPs. (h) Quantification (n≥4). i–j, Ey misexpression reduces Grh expression in INPs. (j) Quantification (n≥5). k–l, EyRNAi extends the INP cell lineage. (k) Wild type MARCM clones induced early in single INPs never contain an INP at the end of larval life; (l) EyRNAi MARCM clones maintain a single INP at the end of larval life (n≥10 clones). m, Summary. Black arrows, positive regulation; black T-bars, negative regulation; gray arrows, external positive regulation. Scale bars, 10 µm. All data represent mean ± s.d. NS, not significant. **P<0.01, ***P<0.001.
Fig 3
Fig 3. INPs sequentially generate distinct temporal identities
a, Genetics of permanent lineage tracing. b–d, Permanent lineage tracing of all INP progeny using R12E09D-gal4. Summary of GFP expression (b); expression of D and Bsh in the GFP+ INP progeny (c,d); dashed line surrounds GFP+ cells. e–i, Permanent lineage tracing of old INP progeny using the late INP OK107Ey-gal4 line. Summary of GFP expression (e); D+ and Bsh+ neurons are excluded from late INP progeny (f,g) whereas Toy+ neurons and Repo+ glia are among the late-born INP progeny (h,i); dashed line surrounds GFP+ cells. j–k, Quantification (j) and summary (k). GFP+ INP progeny in DM1–6 lineages were counted, n≥3 brain lobes for each marker. Region of dorsomedial brain imaged at 120h ALH (boxed in cartoon). Scale bars, 5 µm. All data represent mean ± s.d. NS, not significant. ***P<0.001.
Fig 4
Fig 4. Eyeless is a temporal identity factor for late-born INP progeny
a–i, EyRNAi in INP lineages does not affect early-born INP progeny (a–d), but eliminates late-born Toy+ neurons (e–f) and Repo+ neuropil glia (g–h). (i) Quantification (n≥4 brain lobes). j–n, Ey misexpression in INP lineages leads to loss of early-born Bsh+ neurons (j,k), and increases the number of late-born Toy+ neurons (l,m). (n) Quantification (n≥5). o, Summary. Region of dorsomedial brain imaged at 120h ALH (boxed in cartoon). Scale bars, 5 µm. All data represent mean ± s.d. NS, not significant. **P<0.01, ***P<0.001.
Fig 5
Fig 5. Eyeless is required for adult brain central complex morphology and behavior
a–d, Permanent lineage tracing of old INPs and their progeny (OK107Ey >>act-gal4) extensively labels the adult central complex. e–n, EyRNAi (f–l), ToyRNAi (m), or GcmRNAi (n) in INPs lineages produce distinct defects in CCX morphology. Adult brains, frontal view. The z-coordinates of single confocal sections are shown relative to EB position. The PB was cropped out of the brain and displayed as a projection of indicated z-coordinates in (d,k,l). Scale bars, 20 µm. o, Quantification of the width of CCX compartments (n≥5). p, Summary of CCX morphology upon loss of late-born INP progeny. q, EyRNAi flies have deficits in negative geotaxis. All data represent mean ± s.d. NS, not significant. *P<0.05, **P<0.01, ***P<0.001.
Fig 6
Fig 6. INP temporal patterning acts combinatorially with NB temporal patterning to increase neural diversity
a–b, Expression of D, Castor (Cas), and Seven-up (Svp) in the anterior-most type II NBs. Type II NBs are identified with pointed-gal4 UAS-GFP (green) and Dpn (magenta). c–d, Schematics of INP permanent lineage tracing with R12E09D-gal4 induced at early (c) or late (d) larval stages; all timepoints analyzed at 120h ALH. Gray shading, labeled INP and progeny. e–f, Bsh+ neurons and Repo+ glia are both marked by permanent labeling early in type II NB lineages. Focal planes: Bsh, near NB; Repo, further from the NB (−34 µm). g–h, Bsh+ neurons, but not Repo+ glia, are marked by permanent labeling late in type II NB lineages. Focal planes: Bsh, near NB; Repo, further from the NB (−40 µm). Scale bars, 5 µm. i, Quantification. n=5 for each timepoint. All data represent mean ± s.d. NS, not significant. ***P<0.001. j, Distinct neural progeny are born from early versus late type II NB lineages. k, NB and INP temporal patterning act combinatorially to generate neural diversity.

Comment in

References

    1. Tanabe Y, Jessell TM. Diversity and pattern in the developing spinal cord. Science. 1996;274:1115–1123. - PubMed
    1. Krumlauf R, et al. Hox homeobox genes and regionalisation of the nervous system. Journal of neurobiology. 1993;24:1328–1340. - PubMed
    1. Maurange C, Cheng L, Gould AP. Temporal transcription factors and their targets schedule the end of neural proliferation in Drosophila. Cell. 2008;133:891–902. - PubMed
    1. Brody T, Odenwald WF. Programmed transformations in neuroblast gene expression during Drosophila CNS lineage development. Dev Biol. 2000;226:34–44. - PubMed
    1. Isshiki T, Pearson B, Holbrook S, Doe CQ. Drosophila neuroblasts sequentially express transcription factors which specify the temporal identity of their neuronal progeny. Cell. 2001;106:511–521. - PubMed

Publication types

MeSH terms