. 2013 Jun 19;5(190):190ra81.
doi: 10.1126/scitranslmed.3006276.

Silver enhances antibiotic activity against gram-negative bacteria

Affiliations

Silver enhances antibiotic activity against gram-negative bacteria

J Ruben Morones-Ramirez et al. Sci Transl Med. .

Abstract

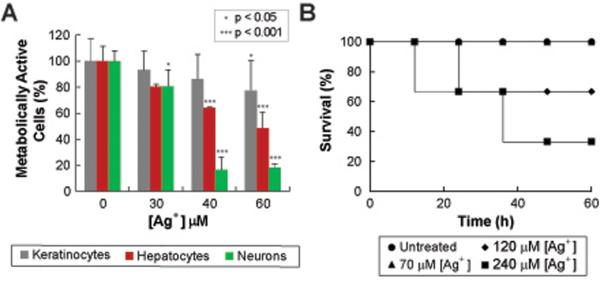
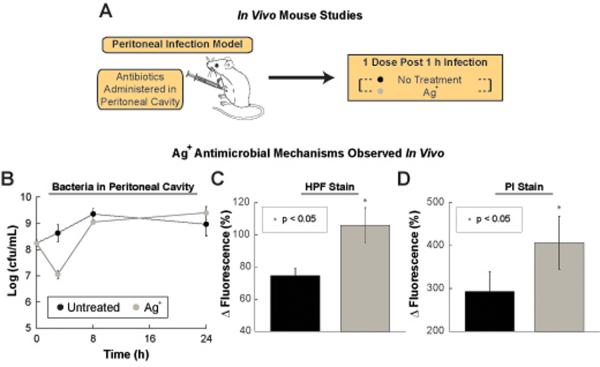
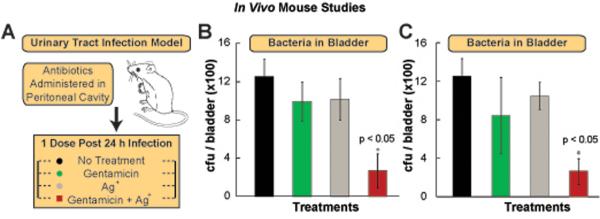
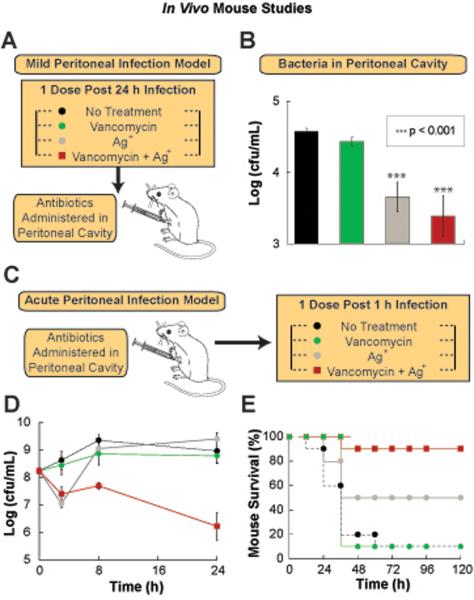
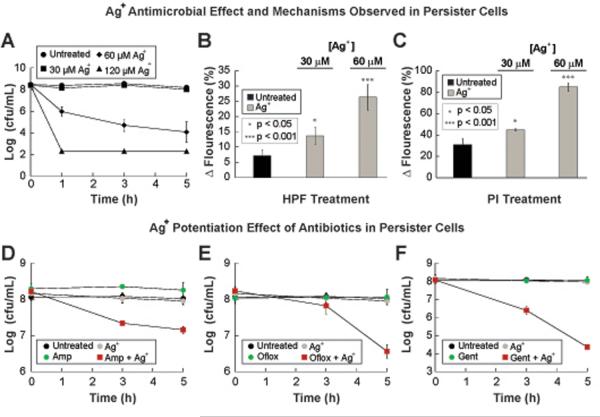
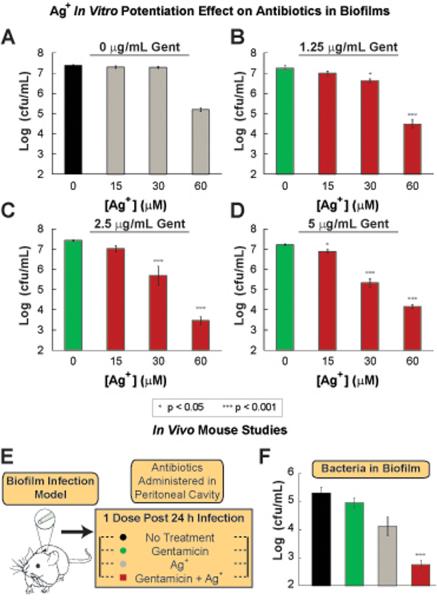
A declining pipeline of clinically useful antibiotics has made it imperative to develop more effective antimicrobial therapies, particularly against difficult-to-treat Gram-negative pathogens. Silver has been used as an antimicrobial since antiquity, yet its mechanism of action remains unclear. We show that silver disrupts multiple bacterial cellular processes, including disulfide bond formation, metabolism, and iron homeostasis. These changes lead to increased production of reactive oxygen species and increased membrane permeability of Gram-negative bacteria that can potentiate the activity of a broad range of antibiotics against Gram-negative bacteria in different metabolic states, as well as restore antibiotic susceptibility to a resistant bacterial strain. We show both in vitro and in a mouse model of urinary tract infection that the ability of silver to induce oxidative stress can be harnessed to potentiate antibiotic activity. Additionally, we demonstrate in vitro and in two different mouse models of peritonitis that silver sensitizes Gram-negative bacteria to the Gram-positive-specific antibiotic vancomycin, thereby expanding the antibacterial spectrum of this drug. Finally, we used silver and antibiotic combinations in vitro to eradicate bacterial persister cells, and show both in vitro and in a mouse biofilm infection model that silver can enhance antibacterial action against bacteria that produce biofilms. This work shows that silver can be used to enhance the action of existing antibiotics against Gram-negative bacteria, thus strengthening the antibiotic arsenal for fighting bacterial infections.


Figures

Fig. 1
Fig. 1. Ag+ induces OH• production through a metabolic cascade and iron misregulation
(A) Kill curves for log-phase growing wildtype E. coli treated with various concentrations of AgNO3. (B) Bright field and fluorescence microscopy of HPF-stained untreated E. coli cells and cells treated with 30 μM AgNO3 after 1 h. (C) Survival of iron homeostasis gene knockout mutants relative to wildtype when treated with 30 μM AgNO3. (D) Free iron [Fe+2] concentration in a cell lysate after 1 h treatment with heat (90 °C) or 30 μM AgNO3. (E) Survival of an electron transport gene knockout mutant relative to wildtype when treated with 30 μM AgNO3. (F) GFP fluorescence histogram from the soxS reporter, incorporated into a wildtype and ΔcydB strain of E. coli, after 1 h treatment with 30 μM AgNO3. (G) Survival of TCA cycle gene knockout mutants relative to wildtype when treated with 30 μM AgNO3. (H) Blue bars show percent change in fluorescence for 3'-(p-hydroxyphenyl) fluorescein (hydroxyl radical production), HPF-stained wildtype and TCA cycle mutant strains of E. coli treated for 1 h with 30 μM AgNO3 relative to the HPF-stained untreated strains. The diamond data points represent percent survival after 1 h of treatment with 30 μM AgNO3. Error bars represent mean ± SEM for at least 3 biological replicates. *** indicates a p-value of <0.001 as determined by a student t-test, indicating a significant difference from the untreated lysate in (D) and the treated wildtype in (H).
Fig. 2
Fig. 2. Ag+ increases membrane permeability through disruption of disulfide bond formation and misfolded protein secretion
(A) Transmission electron microscopy micrographs showing untreated (left) and 30 μM AgNO3-treated E. coli. The red arrow indicates a cell showing outer membrane separation, which is indicative of membrane stress. The black arrow indicates a cell exhibiting protein aggregation (10). (B) Bright field and fluorescence microscopy of PI-stained untreated cells and cells treated for 1 h with 30 μM AgNO3. (C) Change in green fluorescent protein (GFP) fluorescence from the disulfide bond genetic reporter strain after 1 h of the following treatments: 30 μM AgNO3, 0.5 mM H2O2, and the combination of both. Values shown are relative to fluorescence at time zero before treatment. (Inset) Schematic of the reporter strain, which is based on activation of the dps promoter. (D) Survival of disulfide bond formation gene knockout mutants relative to wildtype when treated with 30 μM AgNO3. (E) Change in fluorescence of propidium iodide (membrane permeability), PI-stained wildtype, ΔdsbA, and ΔsecG strains of E. coli after 1 h treatment with 30 μM AgNO3. (F) Survival of protein secretion gene knockout mutants relative to wildtype when treated with 30 μM AgNO3. Error bars represent mean ± SEM for at least 3 biological replicates. *** indicates a p-value of <0.001 as determined by a student t-test, indicating a significant difference from the untreated control in (C) and the treated wildtype in (E).
Fig. 3
Fig. 3. Ag+ potentiates bactericidal antibiotics in vitro
(A) Log change in cfu/mL, from time zero, of wildtype E. coli after treatment for 3 h with 15 μM AgNO3, 0.25 μg/mL gentamicin, 0.03 μg/mL ofloxacin, 1 μg/mL ampicillin, and combinations of AgNO3 with the respective antibiotics. (B) Changes in HPF fluorescence after 1 h of administering the treatments described in (A). (C) Log change in cfu/mL, from time zero, of wildtype E. coli after treatment for 3 h with the indicated concentrations of AgNO3 and 30 μg/mL vancomycin. (D) Changes in PI fluorescence after 1 h of administering different concentrations of AgNO3. Error bars represent mean ± SEM for at least 6 biological replicates. 10 mice per treatment group were used for the survival studies. (E) Treatment of a drug-resistant E. coli strain with Ag+ restores antibiotic susceptibility back to wildtype levels. Tetracycline MIC of wildtype E. coli (AG100) and that of an E. coli drug-resistant strain (AG112) with and without Ag+ treatment. *** indicates a p-value of <0.001 and ** indicates a p-value of <0.05 as determined by a student t-test, indicating a significant difference from the wildtype strain or untreated control, unless otherwise specified. Error bars represent mean ± SEM for at least 3 biological replicates.
Fig. 4
Fig. 4. Toxicity studies of Ag+ showing that low levels of Ag+ are not cytotoxic
(A) Percentage of metabolically active human cell lines (keratinocytes, hepatocytes and neurons) after being treated with increasing Ag+ concentrations. (B) Survival of mice treated with: no treatment, 70 μM, 120 μM and 240 μM of AgNO3. Survival studies were done using 10 mice per group. *** indicates a p-value of <0.001 and * indicates a p-value of <0.05 as determined by a student t-test, indicating a significant difference from the untreated control. Error bars represent mean ± SEM for at least 3 biological replicates.
Fig. 5
Fig. 5. Mode of action of Ag+ in in vivo mild and acute peritonitis models
(A) Schematic of the in vivo animal experiments. (B) Bacterial counts in peritoneal cavity for experiment showing in vivo Ag+ bactericidal mechanism of action. Kill curves of wildtype E. coli within the peritoneal cavity of mice after no treatment and treatment with 6 mg AgNO3/kg body weight (35 μM). (C) Change in fluorescence of the HPF-stained and (D) PI-stained E. coli cells harvested from the peritoneal cavity of mice that have developed a peritoneal infection for 3 h and are treated 1 h after (4 h total after infection) with 6 mg AgNO3/kg body weight (35 μM). Error bars represent mean ± SEM for at least 10 biological replicates. ** indicates a p-value of <0.05 as determined by a student t-test, indicating a significant difference from the untreated control.
Fig. 6
Fig. 6. Ag+ potentiates bactericidal antibiotic activity in vivo in a urinary tract mouse infection model
(A) Schematic of the experimental protocol for the urinary tract infection mouse model. (B) CFU of wildtype E. coli found in the bladder of infected mice 24 h after no treatment or treatment with 1.25 mg gentamicin/kg body weight, 6 mg AgNO3/kg body weight (35 μM), and 1.25 mg gentamicin/kg body weight in combination with 6 mg AgNO3/kg body weight. (C) CFU of wildtype E. coli found in the bladder of mice after 24 h treatment with: no treatment, 2.5 mg gentamicin/kg body weight, 3 mg AgNO3/kg body weight (15 μM), and 2.5 mg gentamicin/kg body weight in combination with 3 mg AgNO3/kg body weight. Error bars represent mean ± SEM for at least 6 biological replicates. *** indicates a p-value of <0.001 and ** indicates a p-value of <0.05 as determined by a student t-test, indicating a significant difference from the untreated control, unless otherwise indicated.
Fig. 7
Fig. 7. Ag+ potentiates vancomycin activity in a mouse peritonitis infection model
(A) Schematic of the experimental protocol for the mild peritonitis mouse model. (B) Kill curves of wildtype E. coli within the peritoneal cavity of mice after no treatment or treatment with 30 mg vancomycin/kg body weight, 6 mg AgNO3/kg body weight (35 μM), and 30 mg vancomycin/kg body weight in combination with 6 mg AgNO3/kg body weight. (C) Schematic of the experimental protocol for the acute mouse models of peritonitis. (D) Kill curves of wildtype E. coli within the peritoneal cavity of mice after no treatment or treatment with 30 mg vancomycin/kg body weight, 6 mg AgNO3/kg body weight (35 μM), and 30 mg vancomycin/kg body weight in combination with 6 mg AgNO3/kg body weight. (E) Survival of mice, with an acute intraperitoneal infection induced with an initial inoculum of 5×10⁶ wildtype E. coli, after no treatment or treatment with30 mg vancomycin/kg body weight, 6 mg AgNO3/kg body weight (35 μM), and 30 mg vancomycin/kg body weight in combination with 6 mg AgNO3/kg body weight. Error bars represent mean ± SEM for at least 6 biological replicates. ** indicates a p-value of <0.05 as determined by a student t-test, indicating a significant difference from the untreated control. 10 mice per treatment group were used for the survival studies.
Fig. 8
Fig. 8. Ag+ potentiates bactericidal antibiotic activity in vitro against bacterial persister cells
(A) Kill curves for persister E. coli cells treated with various concentrations of AgNO3. (B) Changes in HPF fluorescence after 3 h of administering AgNO3 at various concentrations. (p<0.05 and 0.001 for 30 and 60 μM, respectively) (C) Changes in PI fluorescence after 3 h of administering different concentrations of AgNO3. (p<0.05 and 0.001 for 30 and 60 μM, respectively) (D, E) Kill curves for E. coli persister cells treated with 30 μM AgNO3, 5 μg/mL gentamicin (Gent), 3 μg/mL ofloxacin (Oflox), 10 μg/mL ampicillin (Amp), and combinations of AgNO3 with the respective antibiotics. Error bars represent mean ± SEM for at least 6 biological replicates. *** indicates a p-value of <0.001 and ** indicates a p-value of <0.05 as determined by a student t-test, indicating a significant difference from the untreated control, unless otherwise indicated.
Fig. 9
Fig. 9. Ag+ potentiates bactericidal antibiotics against biofilms both in vitro and in vivo
(A)–(D) Log (cfu/mL) of E. coli within biofilms after treatment for 5 h with combinations of various AgNO3 concentrations, and (A) 0, (B) 1.25, (C) 2.5 and (D) 5 μg/mL gentamicin (Gent). (E) Schematic of the in vivo biofilm infection model. (F) CFU of wildtype E. coli found in the disrupted biofilm from the catheter 24 h after treatment with: no treatment, 2.5 mg gentamicin/kg body weight, 6 mg AgNO3/kg body weight (35 μM), and 2.5 mg gentamicin/kg body weight in combination with 6 mg AgNO3/kg body weight. Error bars represent mean ± SEM for at least 6 biological replicates. *** indicates a p-value of <0.001 and ** indicates a p-value of <0.05 as determined by a student t-test, indicating a significant difference from the untreated control, unless otherwise indicated.

References

    1. Taubes G. The bacteria fight back. Science. 2008;321:356. - PubMed
    1. Li J, et al. Colistin: the re-emerging antibiotic for multidrug-resistant Gram-negative bacterial infections. Lancet Infect. Dis. 2006;6:589. - PubMed
    1. Pages JM, James CE, Winterhalter M. The porin and the permeating antibiotic: a selective diffusion barrier in Gram-negative bacteria. Nature Reviews Microbiology. 2008;6:893. - PubMed
    1. Li J, et al. Colistin: the re-emerging antibiotic for multidrug-resistant Gram-negative bacterial infections. Lancet Infectious Diseases. 2006;6:589. - PubMed
    1. Falagas ME, Kasiakou SK. Colistin: the revival of polymixins for the management of multidrug-resistant Gram-negative bacterial infections. Clinical Infectious Diseases. 2005;40:1333. - PubMed

Publication types

MeSH terms