. 2013 Jun 19;33(25):10221-34.
doi: 10.1523/JNEUROSCI.2757-12.2013.

p75 neurotrophin receptor is a clock gene that regulates oscillatory components of circadian and metabolic networks

Affiliations

p75 neurotrophin receptor is a clock gene that regulates oscillatory components of circadian and metabolic networks

Bernat Baeza-Raja et al. J Neurosci. .

Abstract

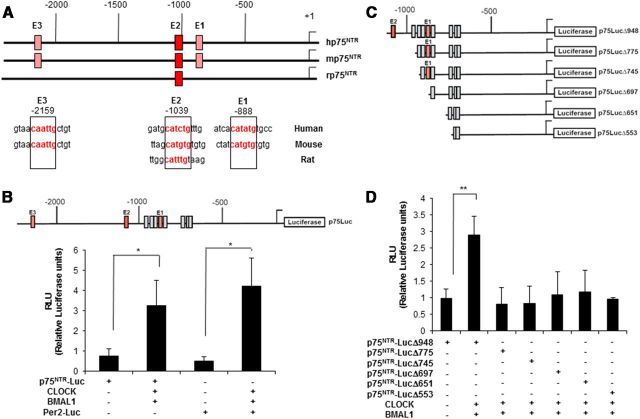
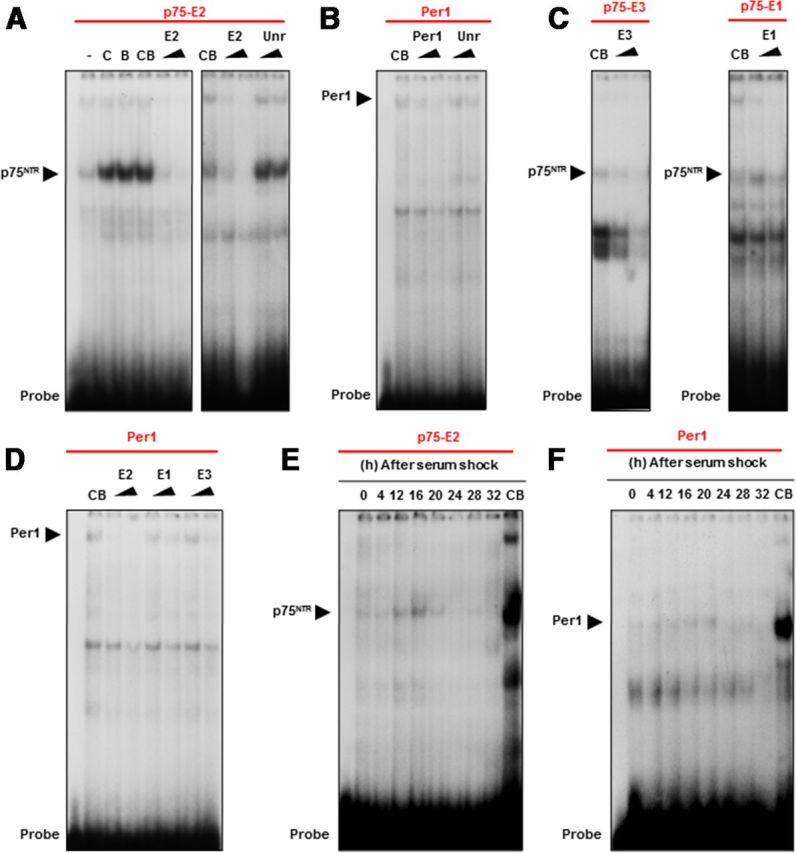
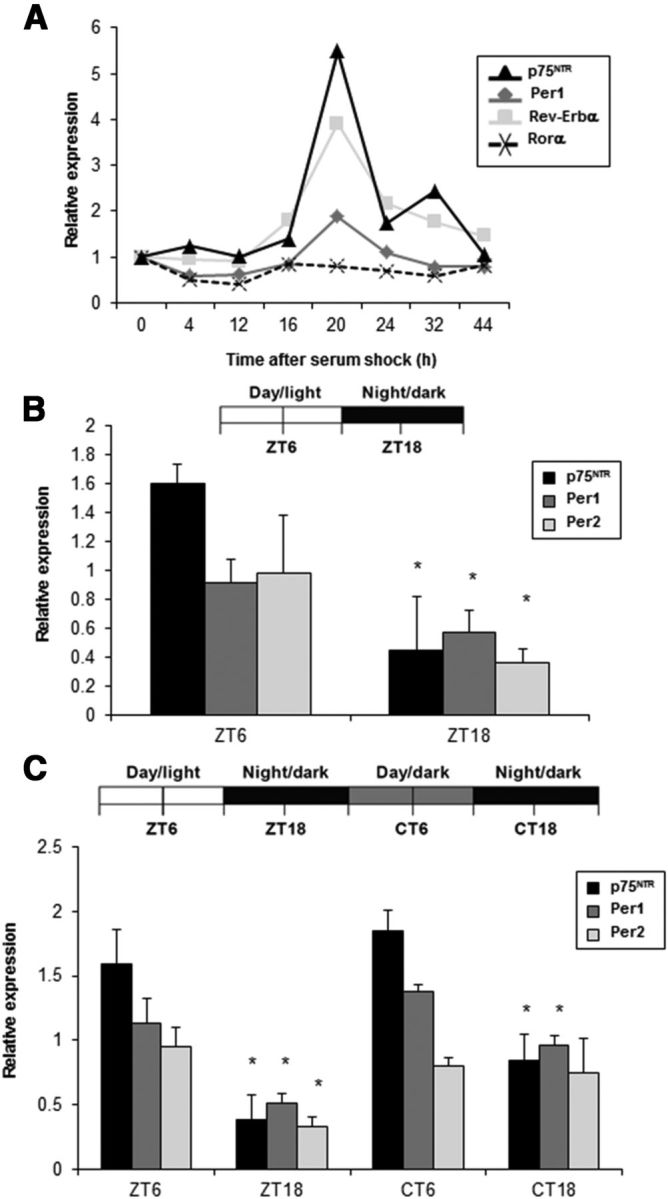
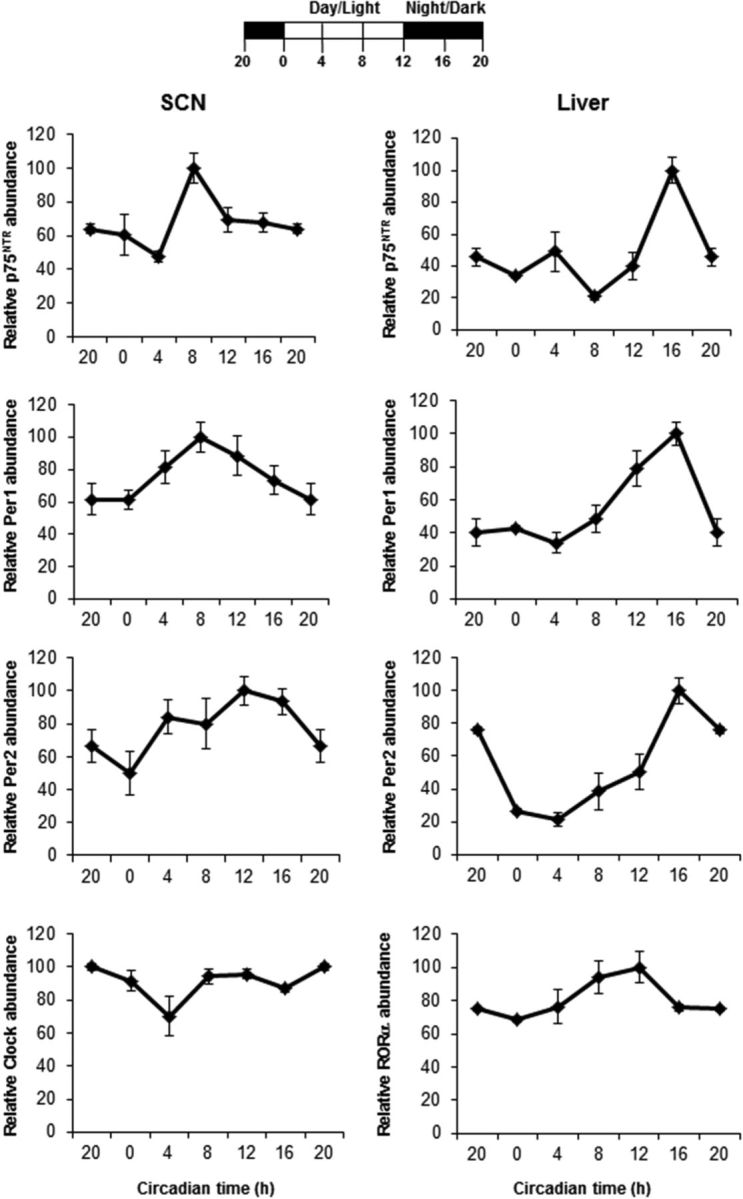
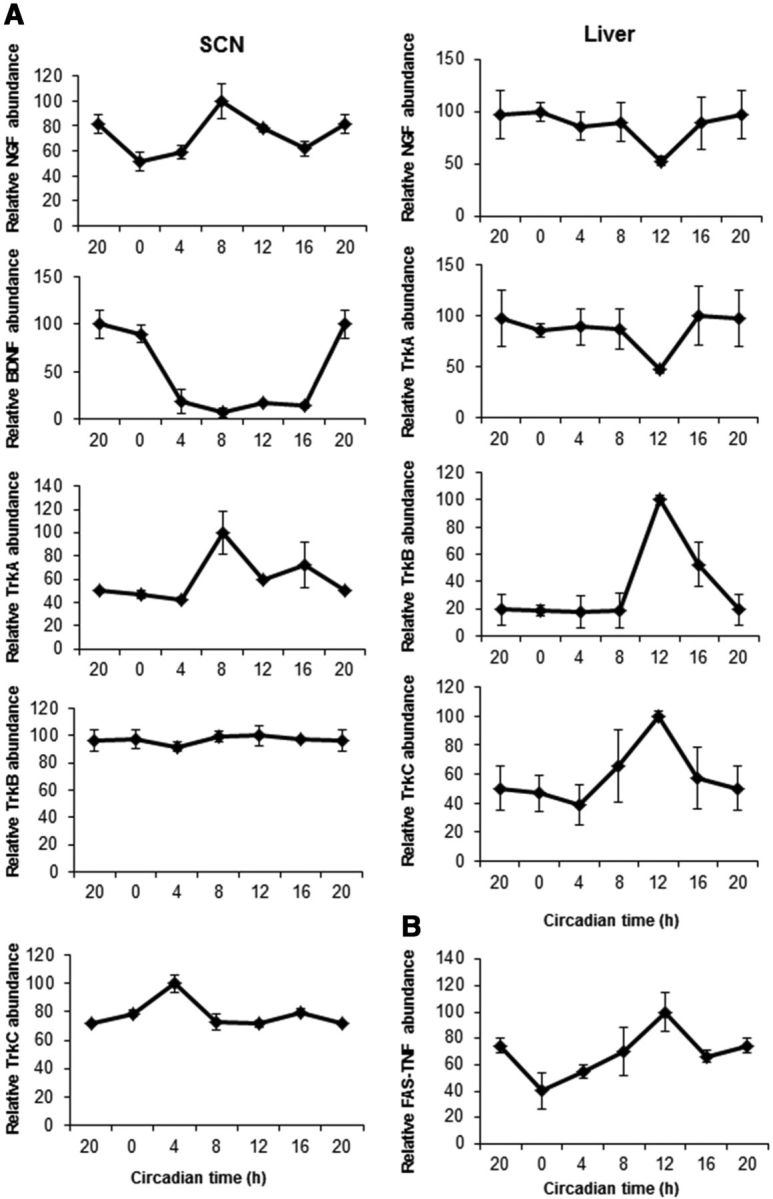
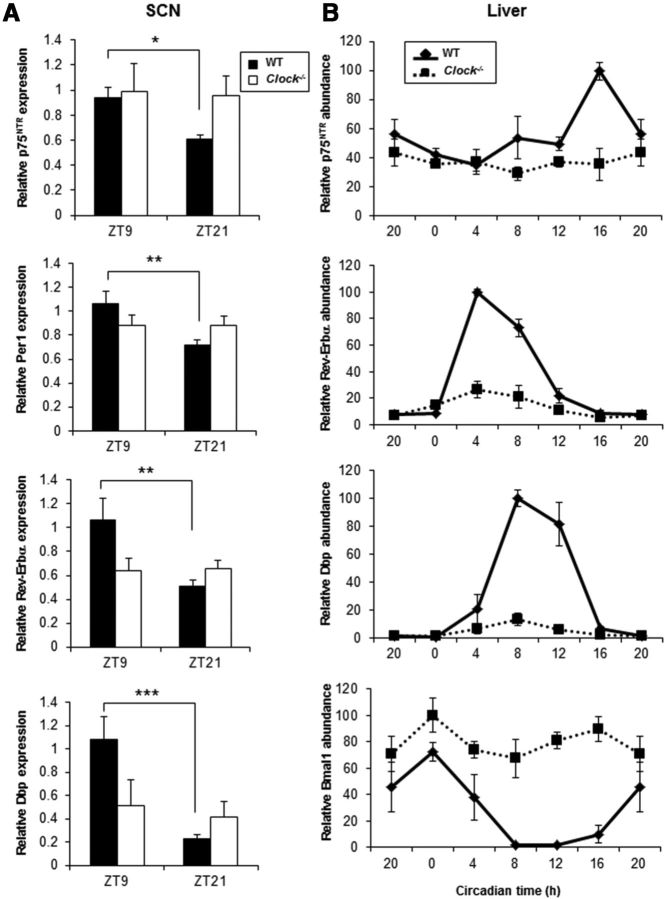
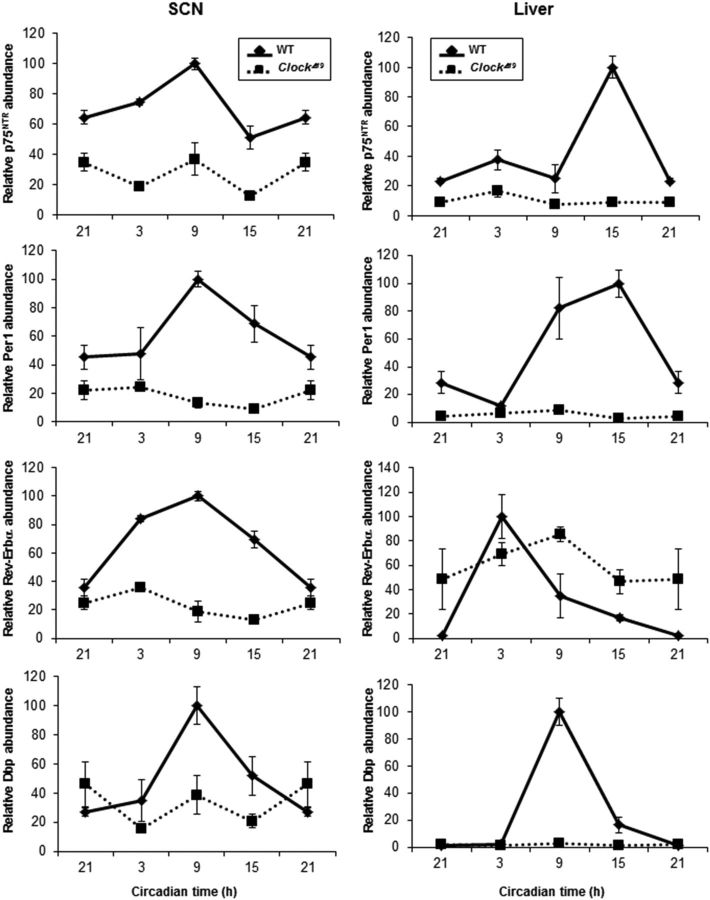
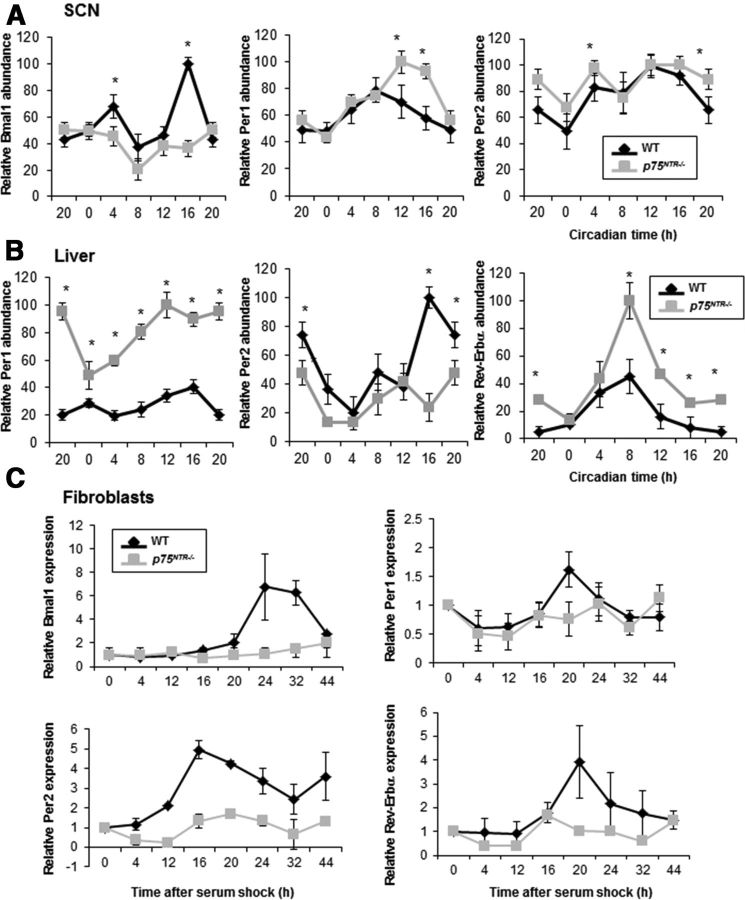
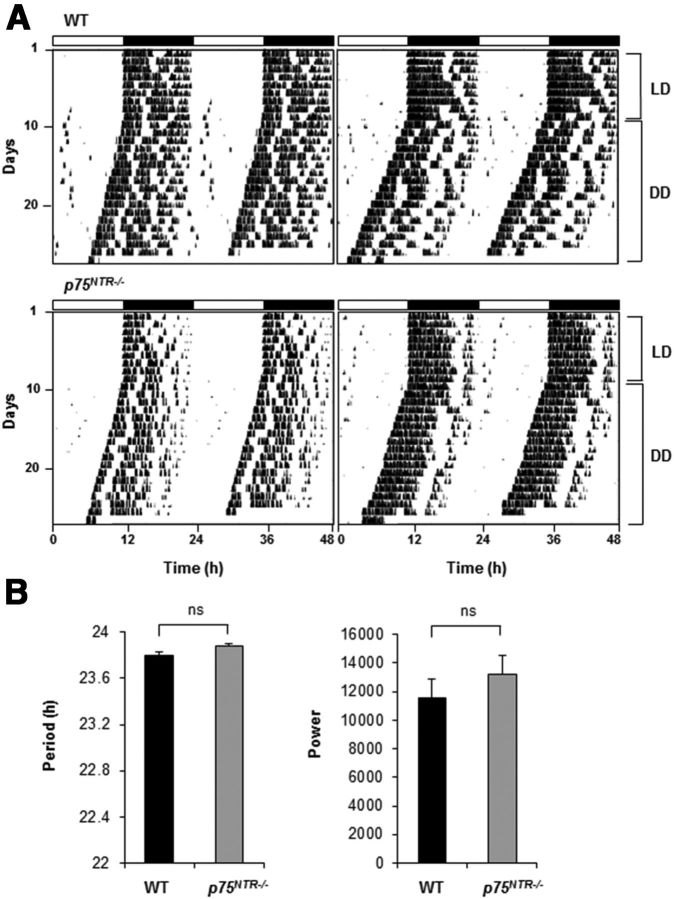
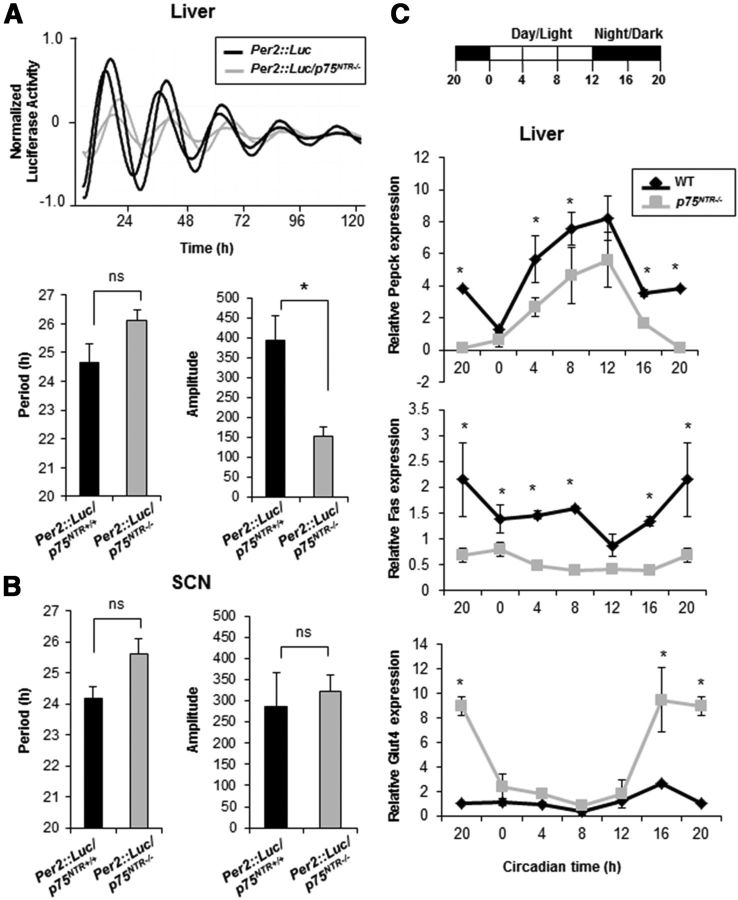
The p75 neurotrophin receptor (p75(NTR)) is a member of the tumor necrosis factor receptor superfamily with a widespread pattern of expression in tissues such as the brain, liver, lung, and muscle. The mechanisms that regulate p75(NTR) transcription in the nervous system and its expression in other tissues remain largely unknown. Here we show that p75(NTR) is an oscillating gene regulated by the helix-loop-helix transcription factors CLOCK and BMAL1. The p75(NTR) promoter contains evolutionarily conserved noncanonical E-box enhancers. Deletion mutagenesis of the p75(NTR)-luciferase reporter identified the -1039 conserved E-box necessary for the regulation of p75(NTR) by CLOCK and BMAL1. Accordingly, gel-shift assays confirmed the binding of CLOCK and BMAL1 to the p75(NTR-)1039 E-box. Studies in mice revealed that p75(NTR) transcription oscillates during dark and light cycles not only in the suprachiasmatic nucleus (SCN), but also in peripheral tissues including the liver. Oscillation of p75(NTR) is disrupted in Clock-deficient and mutant mice, is E-box dependent, and is in phase with clock genes, such as Per1 and Per2. Intriguingly, p75(NTR) is required for circadian clock oscillation, since loss of p75(NTR) alters the circadian oscillation of clock genes in the SCN, liver, and fibroblasts. Consistent with this, Per2::Luc/p75(NTR-/-) liver explants showed reduced circadian oscillation amplitude compared with those of Per2::Luc/p75(NTR+/+). Moreover, deletion of p75(NTR) also alters the circadian oscillation of glucose and lipid homeostasis genes. Overall, our findings reveal that the transcriptional activation of p75(NTR) is under circadian regulation in the nervous system and peripheral tissues, and plays an important role in the maintenance of clock and metabolic gene oscillation.


Figures

Figure 1.
Figure 1.
The 5′ regulatory region of human, mouse, and rat p75NTR contains evolutionarily conserved E-boxes that are activated by CLOCK and BMAL1. A, Top, Schematic representation of the 2.5 kb upstream region of the human, mouse, and rat p75NTR promoter. Putative evolutionarily conserved E-box positions are shown with red boxes. Bottom, Aligned nucleotide sequences of the evolutionarily conserved human, mouse, and rat E-boxes. Alignment of the p75NTR promoter was performed using the Clustal 2.0.3 multiple sequence alignment program. B, Top, Schematic representation of the 2.2 kb p75NTR promoter cloned in the luciferase reporter vector pGL4.17. Red indicates the evolutionarily conserved E-boxes, while the gray boxes identify other nonconserved E-boxes. Bottom, Histogram of luciferase activity in HEK293 cells transfected with pGL4-p75NTR-Luc or Per2-luc in the presence or absence of CLOCK and BMAL1 expression vectors. Luciferase activities are expressed relative to the activity of the reporter constructs alone, which were given a value of 1 (*p < 0.05, t test). C, Schematic representation of the deletion constructs generated from the 2.2 kb hp75NTR promoter and cloned into the luciferase reporter vector pGL4.17. D, Histogram of luciferase activity in HEK293 cells transfected with the different constructs of the hp75NTR promoter in the presence of CLOCK and BMAL1 expression vectors. Luciferase activities are expressed relative to the activity of the reporter constructs alone, which were given a value of 1. Results of at least three independent experiments with duplicate measurements are shown. Error bars represent the SEM of the mean value. Statistical significance denoted by asterisks is relative to respective control (*p < 0.05; **p < 0.01, t test).
Figure 2.
Figure 2.
CLOCK/BMAL1 heterodimers bind to the E-boxes of the p75NTR promoter in vitro. A–F, EMSAs were performed using nuclear extracts of HEK293 cells cotransfected with CLOCK and BMAL1 (A–D) or MEFs derived from WT mice (E, F) on the different E-boxes (−2159, −1039 and −888 bp) from the human p75NTR and Per1 promoter as probes. CB means CLOCK and BMAL1 (CB) coexpression, a triangle indicates increasing amount of competitor (twofold or 10-fold) of the relevant E-box as indicated by the triangles, and a specific complex is indicated by black arrow. A, EMSAs performed on the E-box located at −1039 bp (E2) in the human p75NTR promoter as probe. Nuclear extracts from HEK293 cells transfected with an empty vector (-), CLOCK (C), BMAL1 (B) and CLOCK/BMAL1 (CB) expression vectors were used. B, EMSA performed on the E-box from the human Per1 promoter as probe. C, EMSAs performed on the E-boxes −2159 (E3) and −888 bp (E1) from the human p75NTR promoter as probe. D, EMSA performed on the E-box from the human Per1 promoter as probe. E, EMSA performed on the E-box located at −1039 bp (E2) in the human p75NTR promoter as probe. Nuclear extracts from WT MEFs were collected at the indicated times (h) after serum treatment. F, EMSA performed on the E-box from the human Per1 promoter as probe. Nuclear extracts from WT MEFs derived from WT mice were collected at the indicated times (h) after serum treatment.
Figure 3.
Figure 3.
p75NTR RNA oscillates in vitro and in vivo. A, Serum shock treatment was performed on MEFs derived from WT mice, and cells were collected at the indicated times (h). p75NTR, Per1, Rev-Erbα, and RORα mRNA levels were analyzed by real-time PCR. Data are presented as the relative expression level with respect to time 0, which was given a value of 1. B, Top, Schematic representation of the light schedule. Mice were entrained in a 12 h light/dark cycle and killed at ZT6 and ZT18 (n = 5 per group). Bottom, At the indicated times, the SCN was dissected; RNA was extracted; and p75NTR, Per1, and Per2 levels analyzed by real-time PCR. C, Top, Schematic representation of the light schedule. Mice entrained in a 12 h light/dark cycle were transferred to DD. Mice were killed at ZT6, ZT18, CT6, and CT18 (n = 5 per group). Bottom, At the indicated times, the SCN was dissected, mRNA extracted and p75NTR, Per1, and Per2 levels analyzed by real-time PCR. Results of at least three independent experiments with duplicate measurements are shown. Error bars represent the SEM of the mean value. Statistical significance denoted by asterisks is relative to the expression obtained during the day/subjective day (*p < 0.05, t test). ZT, Zeitgeber time; CT, circadian time.
Figure 4.
Figure 4.
p75NTR RNA oscillates in a circadian manner in the SCN and liver. Top, Schematic representation of the light schedule. Mice were entrained in a 12 h light/dark cycle and were killed at 4 h intervals (n = 4 per group). Bottom, At the indicated times, the SCN (left) and liver (right) were dissected; RNA was extracted; and the levels of p75NTR, Per1, and Per2, together with nonoscillating control genes such as Clock for the SCN and Rorα for the liver, were analyzed by real-time PCR. The results of at least three independent experiments with duplicate measurements are shown. Data from CT20 are double plotted. Error bars represent the SEM of the mean, where the maximum RNA amount was set to 100. CT, Circadian time.
Figure 5.
Figure 5.
NGF and TrkA RNA oscillate in a circadian manner in the SCN and TrkB and TrkC in the liver. Mice were entrained in a 12 h light/dark cycle and were killed at 4 h intervals (n = 4 per group and genotype). A, At the indicated times, the SCN (left) and liver (right) were dissected; RNA was extracted; and the levels of NGF, BDNF, TrkA, TrkB, and TrkC were analyzed by real-time PCR. B, RNA from SCN was extracted and the level of FAS-TNFα was analyzed by real-time PCR at the indicated times. Results of at least three independent experiments with duplicate measurements are shown. Data from CT20 are double plotted. Error bars represent the SEM of the mean, where the maximum RNA amount was set to 100. CT, Circadian time.
Figure 6.
Figure 6.
Genetic deletion of Clock disrupts p75NTR expression in the SCN and liver. A, Wild-type mice (Clock+/+) and Clock−/− mice were entrained in a 12 h light/dark cycle and killed at ZT9 and ZT21 (n = 4 per group and genotype). SCN was dissected; RNA was extracted; and p75NTR, Per1, Rev-Erbα, and Dbp levels were analyzed by real-time PCR. B, Wild-type mice (Clock+/+) and Clock−/− mice were entrained in a 12 h light/dark cycle and killed at 4 h intervals (n = 3 per group and genotype). At the indicated times, liver was dissected; RNA was extracted; and p75NTR, Rev-Erbα, Dbp, and Bmal1 levels were analyzed by real-time PCR. Data from CT20 are double plotted. Error bars represent the SEM, where the maximum RNA amount was set to 100. Statistical significance denoted by asterisks is relative to the expression obtained during the day/light phase ZT9 (*p < 0.05, **p < 0.01, ***p < 0.001, one-way ANOVA). ZT, Zeitgeber time; CT, circadian time.
Figure 7.
Figure 7.
Genetic mutation of Clock disrupts p75NTR expression in the SCN and liver. Wild-type mice and ClockΔ19 mice were entrained in a 12 h light/dark cycle and killed at 6 h intervals (n = 3 per group and genotype). At the indicated times, SCN (left) and liver (right) were dissected; RNA was extracted; and p75NTR, Per1, Rev-Erbα, and Dbp levels were analyzed by real-time PCR. Data from CT21 are double plotted. Error bars represent the SEM of the mean, where the maximum RNA amount was set to 100. CT, Circadian time.
Figure 8.
Figure 8.
Genetic deletion of p75NTR disrupts clock genes in SCN, liver, and fibroblasts. A, Top, Schematic representation of the circadian entrainment of the mice. Mice were entrained in a 12 h light/dark cycle and were killed at 4 h intervals (n = 4 per group and genotype). Bottom, At the indicated times, the SCN was dissected; RNA was extracted; and Bmal1, Per1, and Per2 levels were analyzed by real-time PCR. Error bars represent the SEM, where the maximum RNA amount was set to 100. B, Mice were entrained in a 12 h light/dark cycle and killed at 4 h intervals. At the indicated times, the liver was dissected; RNA was extracted; and Per1, Per2, and Rev-Erbα levels were analyzed by real-time PCR. Error bars represent the SEM, where the maximum RNA amount was set to 100. C, Serum shock treatment was performed on MEFs derived from WT and p75NTR−/− mice; cells were collected at the indicated times (h); and Bmal1, Per1, Per2, and Rev-Erbα mRNA levels were analyzed by real-time PCR. Data are presented as the relative expression level with respect to time 0, which was given a value of 1. Results of at least three independent experiments with duplicate measurements are shown. Data from CT20 are double plotted. Statistical significance denoted by asterisks is relative to the respective WT time point (*p < 0.05, one-way ANOVA). CT, Circadian time.
Figure 9.
Figure 9.
Circadian locomotor activity of p75NTR−/− mice. A, Representative activity records (actograms) of wild-type mice and p75NTR−/− mice are shown in double-plotted format. Each horizontal line represents 48 h. Vertical bars represents periods of voluntary wheel running activity. B, Periodogram estimates of period (h) for each genotype and power corresponding to circadian amplitude (power-significance from periodogram analyses). Each bar is mean × SEM (n = 14 per genotype). Statistical comparisons were made with Student's t test (ns, not significant).
Figure 10.
Figure 10.
Deletion of p75NTR reduces rhythm amplitudes and affects the expression of genes involved in glucose and lipid metabolism in liver. A, Top, Representative bioluminescence profiles of tissue explants from liver. The two representative profiles shown for each genotype (Per2::Luc p75NTR+/+ and Per2::Luc p75NTR−/−) are from separate experiments. Bottom, Period and amplitude of the bioluminescence profiles from liver explants. Each bar is the mean ± SEM of n (explants)/n (animals); Per2::Luc p75NTR+/+ = 21/7; Per2::Luc p75NTR−/− = 21/7 (*p < 0.05; t test). B, Period and amplitude of the bioluminescence profiles from SCN explants. Each bar is the mean ± SEM of n (explants)/n (animals); Per2::Luc p75NTR+/+ = 28/14; Per2::Luc p75NTR−/− = 28/14 (ns, not significant). C, Top, Schematic representation of the light schedule. Mice were entrained in a 12:12 h light/dark cycle and were killed at 4 h intervals (n = 4 per group). Bottom, At the indicated times, the liver was dissected, RNA extracted, and Pepck, Fas, and Glut4 levels analyzed by real-time PCR. Results of at least three independent experiments with duplicate measurements are shown. Data from CT20 are double plotted. Error bars represent the SEM of the mean value, where the maximum RNA amount was set to 100. Statistical significance denoted by asterisks is relative to the respective WT time point (*p < 0.05, one-way ANOVA).

References

    1. Akhtar RA, Reddy AB, Maywood ES, Clayton JD, King VM, Smith AG, Gant TW, Hastings MH, Kyriacou CP. Circadian cycling of the mouse liver transcriptome, as revealed by cDNA microarray, is driven by the suprachiasmatic nucleus. Curr Biol. 2002;12:540–550. doi: 10.1016/S0960-9822(02)00759-5. - DOI - PubMed
    1. Allen GC, Qu X, Earnest DJ. TrkB-deficient mice show diminished phase shifts of the circadian activity rhythm in response to light. Neurosci Lett. 2005;378:150–155. doi: 10.1016/j.neulet.2004.12.023. - DOI - PubMed
    1. Asher G, Schibler U. Crosstalk between components of circadian and metabolic cycles in mammals. Cell Metab. 2011;13:125–137. doi: 10.1016/j.cmet.2011.01.006. - DOI - PubMed
    1. Bae K, Jin X, Maywood ES, Hastings MH, Reppert SM, Weaver DR. Differential functions of mPer1, mPer2, and mPer3 in the SCN circadian clock. Neuron. 2001;30:525–536. doi: 10.1016/S0896-6273(01)00302-6. - DOI - PubMed
    1. Baeza-Raja B, Li P, Le Moan N, Sachs BD, Schachtrup C, Davalos D, Vagena E, Bridges D, Kim C, Saltiel AR, Olefsky JM, Akassoglou K. p75 neurotrophin receptor regulates glucose homeostasis and insulin sensitivity. Proc Natl Acad Sci U S A. 2012;109:5838–5843. doi: 10.1073/pnas.1103638109. - DOI - PMC - PubMed

Publication types

MeSH terms