. 2013 Jun 13;8(6):e65371.
doi: 10.1371/journal.pone.0065371. Print 2013.

A loss-of-function screen for phosphatases that regulate neurite outgrowth identifies PTPN12 as a negative regulator of TrkB tyrosine phosphorylation

Affiliations

A loss-of-function screen for phosphatases that regulate neurite outgrowth identifies PTPN12 as a negative regulator of TrkB tyrosine phosphorylation

Malene Ambjørn et al. PLoS One. .

Abstract

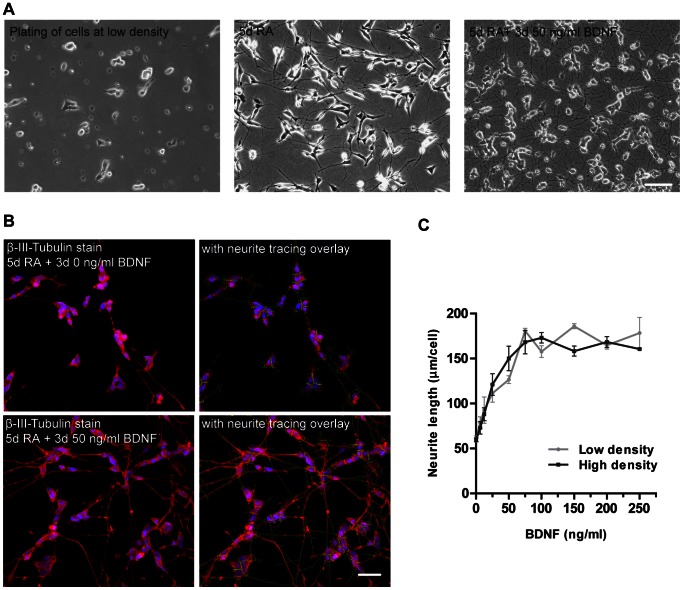
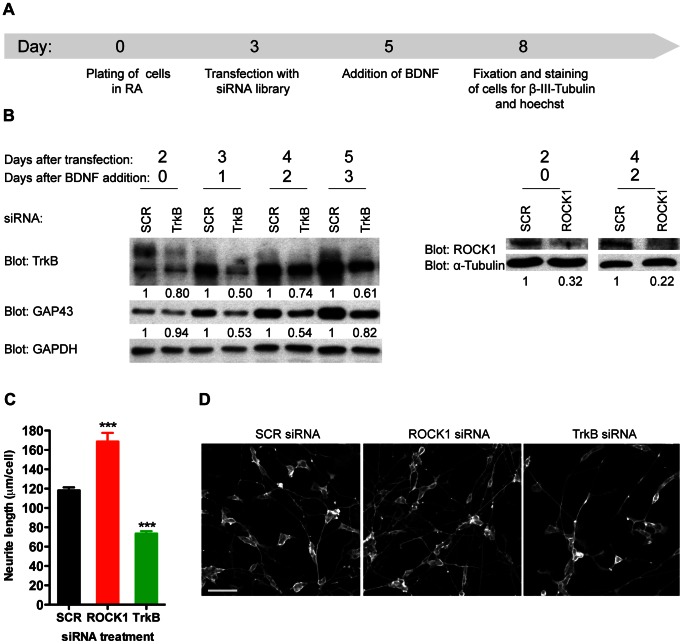
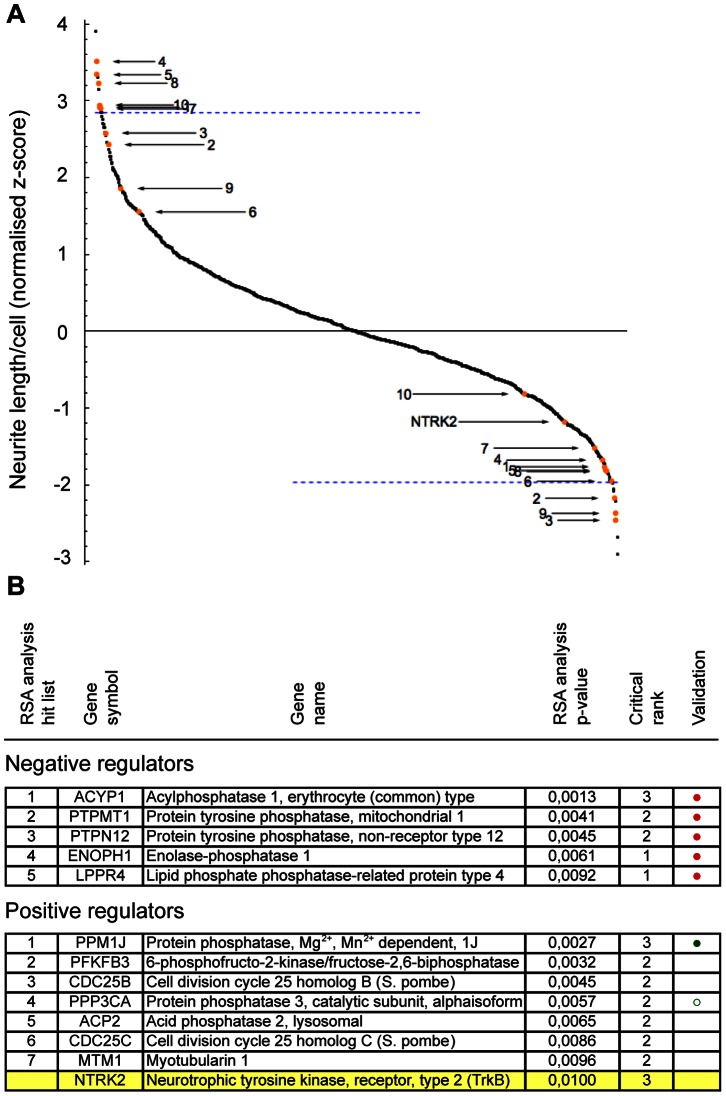
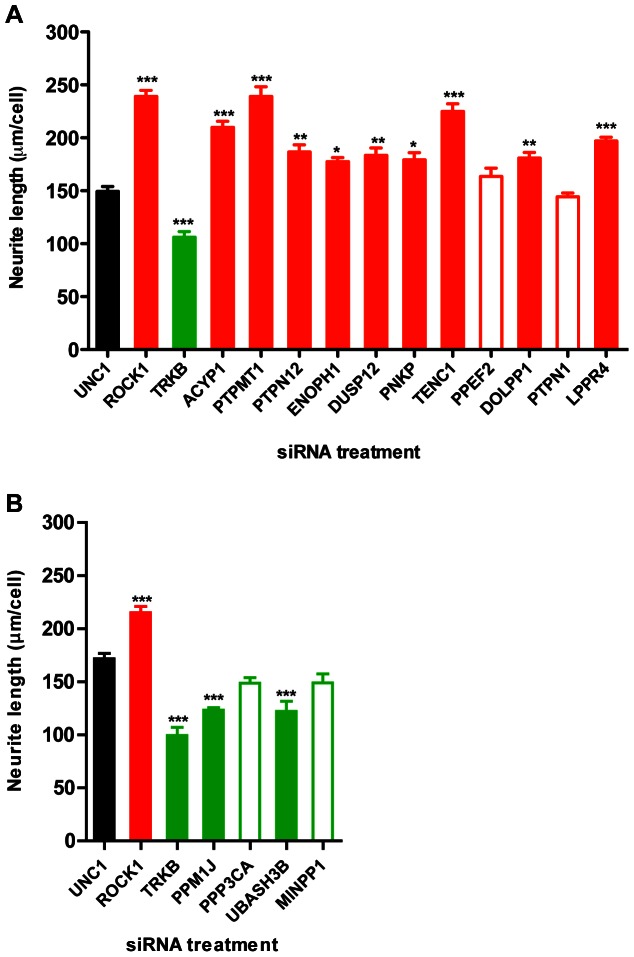
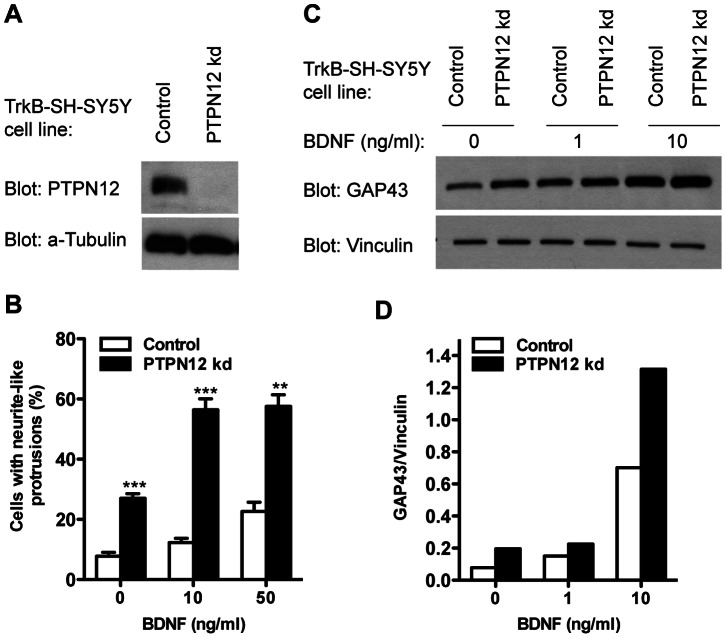
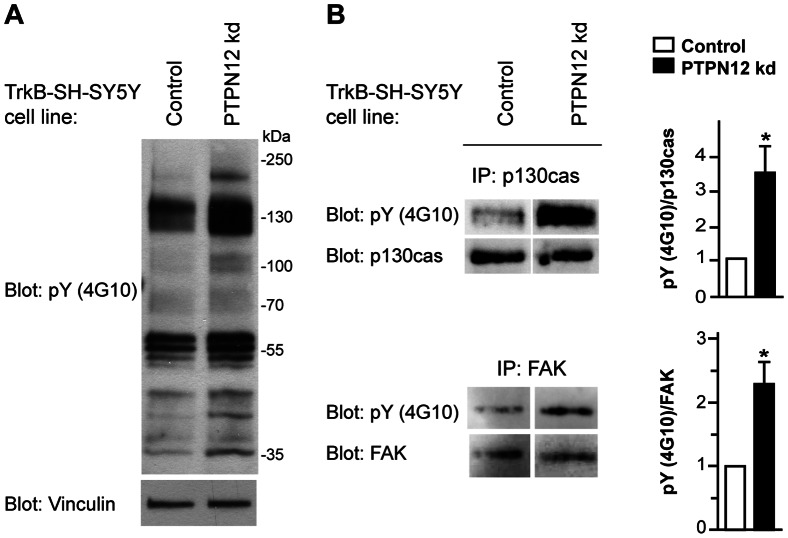
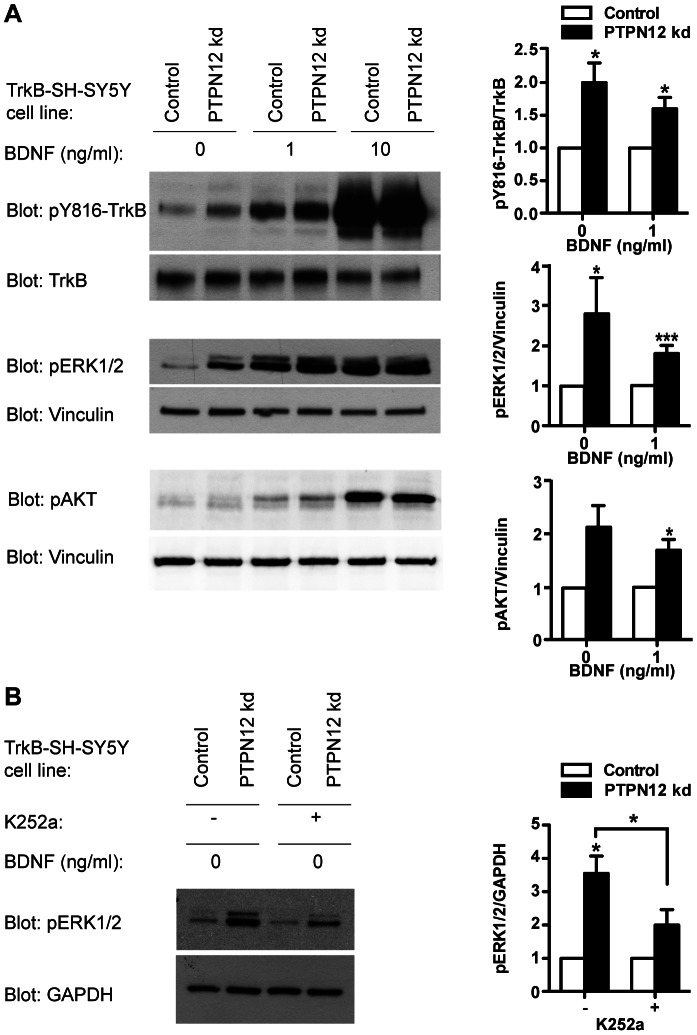
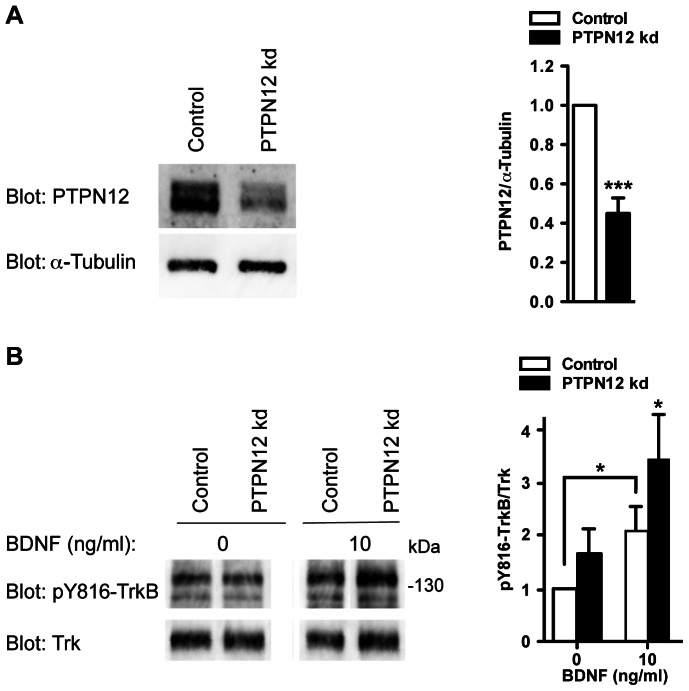
Alterations in function of the neurotrophin BDNF are associated with neurodegeneration, cognitive decline, and psychiatric disorders. BDNF promotes axonal outgrowth and branching, regulates dendritic tree morphology and is important for axonal regeneration after injury, responses that largely result from activation of its tyrosine kinase receptor TrkB. Although intracellular neurotrophin (NT) signaling presumably reflects the combined action of kinases and phosphatases, little is known about the contributions of the latter to TrkB regulation. The issue is complicated by the fact that phosphatases belong to multiple independently evolved families, which are rarely studied together. We undertook a loss-of-function RNA-interference-based screen of virtually all known (254) human phosphatases to understand their function in BDNF/TrkB-mediated neurite outgrowth in differentiated SH-SY5Y cells. This approach identified phosphatases from diverse families, which either positively or negatively modulate BDNF-TrkB-mediated neurite outgrowth, and most of which have little or no previously established function related to NT signaling. "Classical" protein tyrosine phosphatases (PTPs) accounted for 13% of the candidate regulatory phosphatases. The top classical PTP identified as a negative regulator of BDNF-TrkB-mediated neurite outgrowth was PTPN12 (also called PTP-PEST). Validation and follow-up studies showed that endogenous PTPN12 antagonizes tyrosine phosphorylation of TrkB itself, and the downstream activation of ERK1/2. We also found PTPN12 to negatively regulate phosphorylation of p130cas and FAK, proteins with previously described functions related to cell motility and growth cone behavior. Our data provide the first comprehensive survey of phosphatase function in NT signaling and neurite outgrowth. They reveal the complexity of phosphatase control, with several evolutionarily unrelated phosphatase families cooperating to affect this biological response, and hence the relevance of considering all phosphatase families when mining for potentially druggable targets.


Conflict of interest statement

Competing Interests: The authors have declared that no competing interests exist.

Figures

Figure 1
Figure 1. Automatic quantification of neurite outgrowth in RA/BDNF differentiated SH-SY5Y cells.
A) Phase-contrast pictures of SH-SY5Y cells plated at low density (left picture) and cultured for 5 days with 10 µM RA (middle picture) followed by 3 days in 50 ng/ml (∼2 nM) BDNF in serum-free medium (right picture). Scale bar = 50 µm. B) Representative fluorescent pictures of SH-SY5Y cells stained with an anti-β-III-Tubulin antibody and Hoechst 33342. Cells were treated as in A) but with either 0 ng/ml BDNF (upper panel) or 50 ng/ml BDNF (lower panel). The pictures were acquired automatically using an IN Cell 1000 automated high throughput microscope with a Nikon 20× objective. Cells are shown without (left panel) or with (right panel) overlay of the neurite tracing program. Scale bar = 50 µm. C) BDNF-neurite length dose response curve at low or high cell densities (13,000 or 16,000 cells/cm2, respectively). Cells were differentiated for 5 days in RA and 3 days without or with BDNF at various concentrations (0–250 ng/ml), stained as in B), and evaluated for neurite outgrowth using the developed neurite outgrowth algorithm. Data are shown as mean ± S.E.M. of triplicates, and are representative of three individual experiments.
Figure 2
Figure 2. Set-up of siRNA-mediated loss-of-function phosphatase screen in differentiated SH-SY5Y cells.
A) Assay outline for the phosphatase screen. Cells were plated in RA for a total of 5 days. At day 3 cells were transfected for 8 h with 50 nM siRNA in the presence of RA. At day five, 48 h post-transfection, cells were changed into serum-free medium with 10 ng/ml BDNF and left to differentiate for 3 more days. Then cells were fixed and stained with an anti-β-III-Tubulin antibody and Hoechst 33342. Image acquisition and data analysis were carried out automatically (see Materials and Methods). B) Using the set-up described, cells were transfected with scrambled (SCR) siRNA or siRNA targeting TrkB or ROCK1, treated with 50 ng/ml BDNF and lysed on different days as indicated. Expression levels of TrkB, GAP43 and ROCK1 were evaluated using western blotting. GAPDH or α-Tubulin was used as loading controls. Densitometric quantification of the relative protein expression levels is shown below the blots. C) Cells transfected and treated and evaluated as described in A). SCR, TrkB or ROCK1 siRNAs were used. Data are shown as mean and S.E.M. of four replicates and is representative of two independent experiments (***: p≤0.001; using one-way ANOVA followed by Dunnett’s multiple comparison test with SCR siRNA treated cells as a reference). D) Representative pictures of cells transfected with SCR, ROCK1 or TrkB specific siRNAs (day 8 of A). Scale bar = 50 µm.
Figure 3
Figure 3. Primary screen data.
A) Neurite length after siRNA-mediated knockdown of 254 different human phosphatases. Activities of individual siRNAs are plotted as a function of the standard deviation of the median screen activity (z-score) (with each value representing the average from three independent screens). The blue dashed lines mark the “top 10″ activity cut-off for either negative regulators (above zero) or positive regulators (below zero) of neurite outgrowth, while orange dots represent “top 10″ RSA hits (only the most potent siRNA for the particular gene is marked). B) RSA hit list including genes with p≤0.01 in the RSA analysis for either negative or positive regulators of neurite outgrowth. Critical rank indicates how many of the three gene-specific siRNAs contributed to the gene p-value. Filled circles represent hits that have been validated in a separate sub-screen, while open circles represent hits that could not be validated.
Figure 4
Figure 4. Validation of hits from the primary screen.
Some of the hits identified in the main screen (here defined as p<0.05) were tested for validation in a sub-screen following the screen protocol described in Figure 2A using newly purchased siRNAs from another vendor. UNC1 is the scrambled siRNA control while ROCK1 or TrkB targeting siRNAs served as biological controls. A) 11 negative regulators and B) 4 positive regulators were included in the sub-screen. Negative and positive regulators were screened on separate plates, which both included controls. Normalization between plates was not performed, explaining the slight variation in the control values between A) and B). Red and green indicates negative and positive regulators respectively, and filled and open bars represent validated and non-validated hits, respectively. Data are shown as mean and S.E.M. of triplicates (*: p≤0.05; **: p≤0.01; and ***: p≤0.001; using one-way ANOVA followed by Dunnett’s multiple comparison test with UNC1 as reference).
Figure 5
Figure 5. PTPN12 decreases neurite-like outgrowth in TrkB-SH-SY5Y cells.
A) Western blot analysis of PTPN12 expression level in TrkB-SH-SY5Y cells stably expressing a pGIPZ shRNAmir non-targeting PTPN12 (PTPN12 kd) or the non-silencing control. α-Tubulin is used as reference. B) Neurite-like outgrowth in PTPN12 kd cells compared to the control. Cells were seeded at low density and grown for 24 h before stimulation with BDNF as indicated for 3 days in serum-free medium. Cells were then stained with a β-III-Tubulin antibody and Hoechst 33342 and pictures were acquired and analyzed automatically. Data shown are mean and S.E.M. of triplicates and are representative of two independent experiments. Statistical analysis was performed using Student’s t-test comparing PTPN12 kd and control cells for each BDNF concentration (**: p≤0.01; ***: p≤0.001). C) Western blot analysis of cells treated as in B) for GAP43 expression using Vinculin as loading reference. D) Densitometric quantification of the results in C).
Figure 6
Figure 6. PTPN12 changes the phosphotyrosine profile in TrkB-SH-SY5Y cells.
A) Total phosphotyrosine pY levels (4G10 antibody) were revealed by western blotting in lysates from control or PTPN12 kd cells cultured for 24 h and starved for 4 h prior to lysis (basal condition). Vinculin served as loading reference. B) Lysates prepared from cells as in A) were immunoprecipitated (IP) using p130cas or FAK antibodies and blotted for total pY levels (4G10 antibody). Total p130cas and FAK levels were used as the respective references. Densitometric quantification of the tyrosine phosphorylation level of p130cas and FAK (4G10), compared to total p130cas and FAK levels, is shown as mean and S.E.M. of three and five independent experiments respectively, with values normalized to the control. Statistical analysis was performed using Student’s paired t-test (*: p≤0.05).
Figure 7
Figure 7. PTPN12 modulates TrkB signaling in TrkB-SH-SY5Y cells.
A) Western blot analyses for pY816-TrkB, TrkB, pERK1/2, pAKT and Vinculin levels in control and PTPN12 kd cells cultured for 24 h, starved for 4 h and stimulated for 5 min with 0, 1 or 10 ng/ml BDNF. Graphs show densitometric quantifications of pY816-TrkB compared to total TrkB, and pERK1/2 and pAKT compared to total Vinculin, for cells in absence of BDNF (basal level) or with 1 ng/ml BDNF (mean and S.E.M. of three, seven, and four independent experiments respectively). PTPN12 kd values were normalized to the level of the control for each BDNF concentration. NB: p-value = 0.076 for comparison of pAKT between control and PTPN12 kd both at 0 ng/ml BDNF. B) PTPN12 kd and control cells cultured as in A) in the absence of BDNF ± K252a were analyzed for pERK1/2 levels using GAPDH as a reference. Respective densitometric quantifications are shown as mean and S.E.M. of three independent experiments; PTPN12 kd is normalized to the level of the control in the absence or presence of K252a. Statistical analyses were performed using Student’s paired t-test comparing control and Ptpn12 kd, except where otherwise specified (*: p≤0.05; ***: p≤0.005). NB: p-value = 0.060 for comparison of pERK between control and PTPN12 kd both treated with K252.
Figure 8
Figure 8. PTPTN12 knockdown in primary mouse hippocampal neurons enhances tyrosine phosphorylation of TrkB.
A) Western blot analysis of PTPN12 expression in mouse hippocampal neurons expressing a pLKO-shRNA targeting PTPN12 (PTPN12 kd) or a non-silencing control. α-Tubulin is used as reference. Densitometric quantification of PTPN12 expression is shown as mean and S.E.M. of five independent experiments, and values are normalized to the level of the non-silencing control. B) Western blot analysis of pY816-TrkB and Trk levels in mouse hippocampal neurons expressing a pLKO-shRNA targeting PTPN12 (PTPN12 kd) or a non-silencing control. The neurons were cultured for 5 days and then stimulated for 5 min with 0 or 10 ng/ml BDNF. Densitometric quantification of pY816-TrkB compared to total Trk levels are shown as mean and S.E.M. of five independent experiments, and values are normalized to the level of the control in the absence of BDNF. Statistical analyses were performed using Student’s paired t-test comparing control and Ptpn12 kd, except when otherwise specified (*: p≤0.05; ***: p≤0.005).

References

    1. Reichardt LF (2006) Neurotrophin-regulated signalling pathways. Philos Trans R Soc Lond B Biol Sci 361: 1545–1564. - PMC - PubMed
    1. Goslin K, Banker G (1990) Rapid changes in the distribution of GAP-43 correlate with the expression of neuronal polarity during normal development and under experimental conditions. J Cell Biol 110: 1319–1331. - PMC - PubMed
    1. Arimura N, Kaibuchi K (2007) Neuronal polarity: from extracellular signals to intracellular mechanisms. Nat Rev Neurosci 8: 194–205. - PubMed
    1. Lykissas MG, Batistatou AK, Charalabopoulos KA, Beris AE (2007) The role of neurotrophins in axonal growth, guidance, and regeneration. Curr Neurovasc Res 4: 143–151. - PubMed
    1. Chao MV, Rajagopal R, Lee FS (2006) Neurotrophin signalling in health and disease. Clin Sci (Lond) 110: 167–173. - PubMed

Publication types

MeSH terms

Substances