. 2013 Jun 13;8(6):e65821.
doi: 10.1371/journal.pone.0065821. Print 2013.

PTEN loss increases PD-L1 protein expression and affects the correlation between PD-L1 expression and clinical parameters in colorectal cancer

Affiliations

PTEN loss increases PD-L1 protein expression and affects the correlation between PD-L1 expression and clinical parameters in colorectal cancer

Minmin Song et al. PLoS One. .

Abstract

Background: Programmed death ligand-1 (PD-L1) has been identified as a factor associated with poor prognosis in a range of cancers, and was reported to be mainly induced by PTEN loss in gliomas. However, the clinical effect of PD-L1 and its regulation by PTEN has not yet been determined in colorectal cancer (CRC). In the present study, we verified the regulation of PTEN on PD-L1 and further determined the effect of PTEN on the correlation between PD-L1 expression and clinical parameters in CRC.

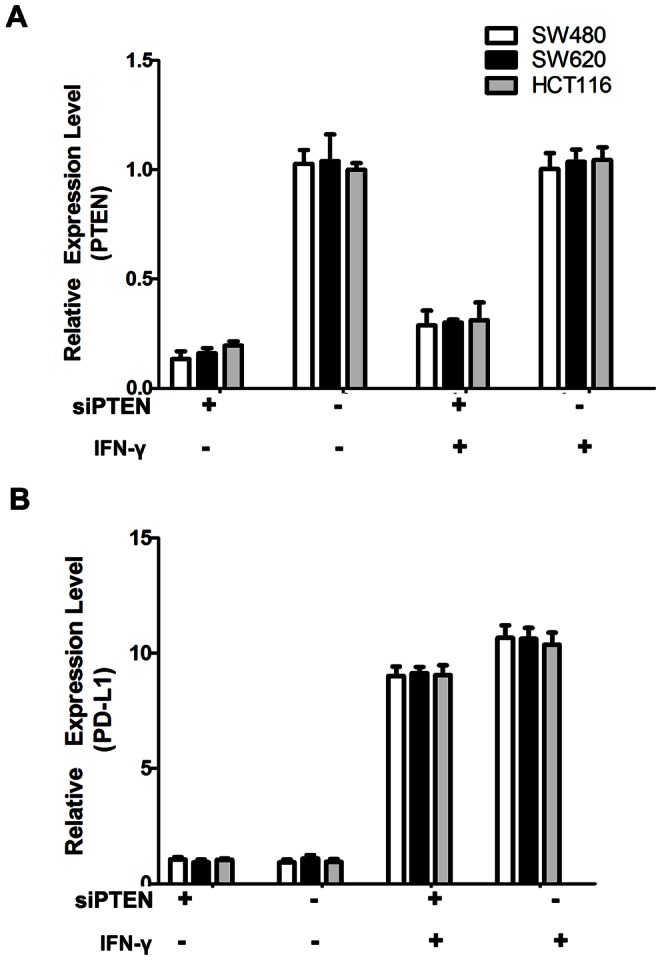
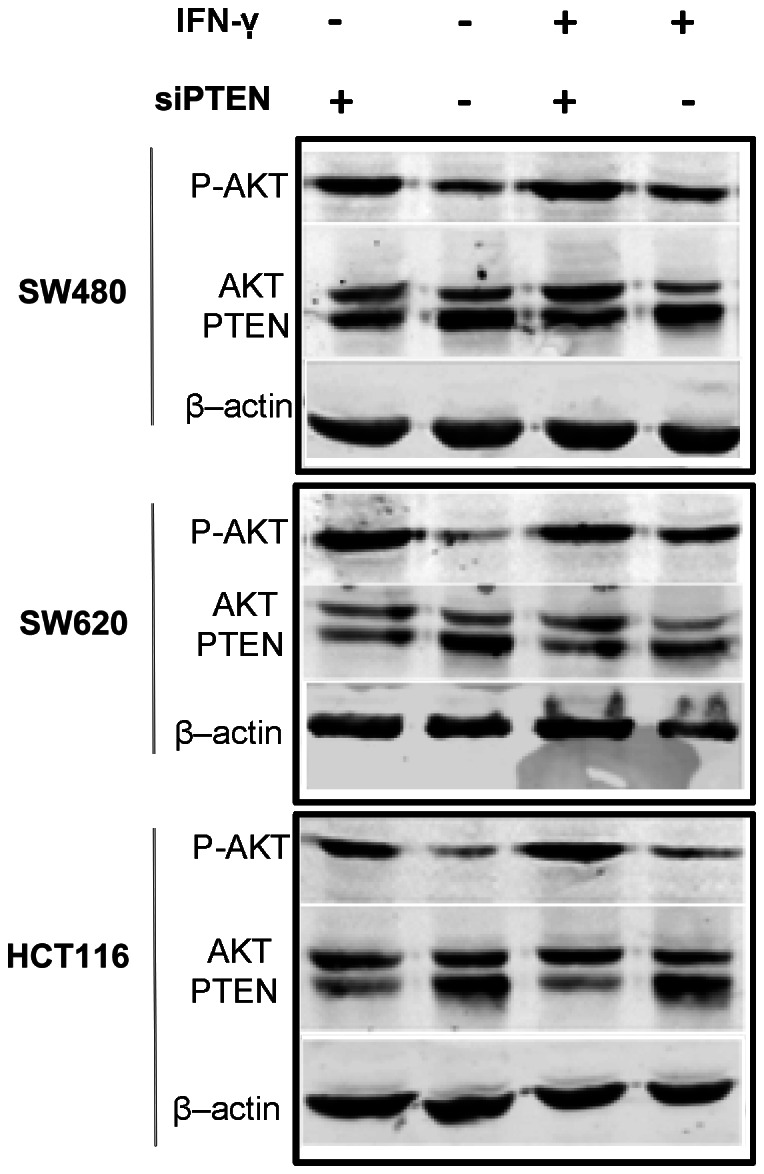
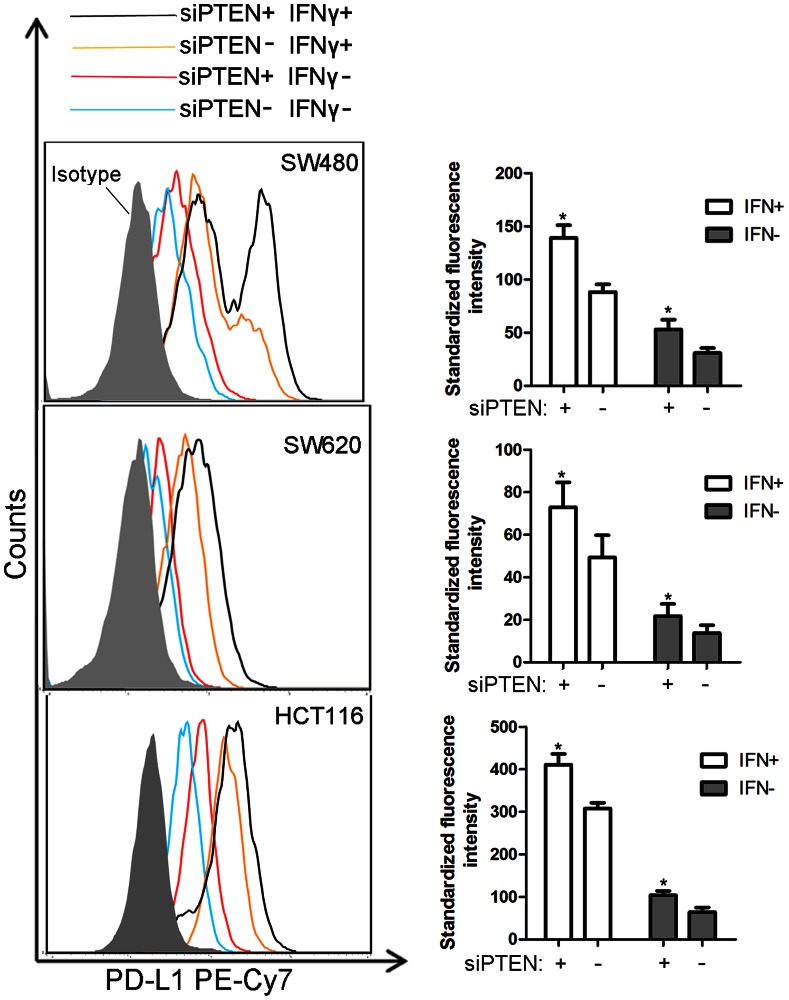
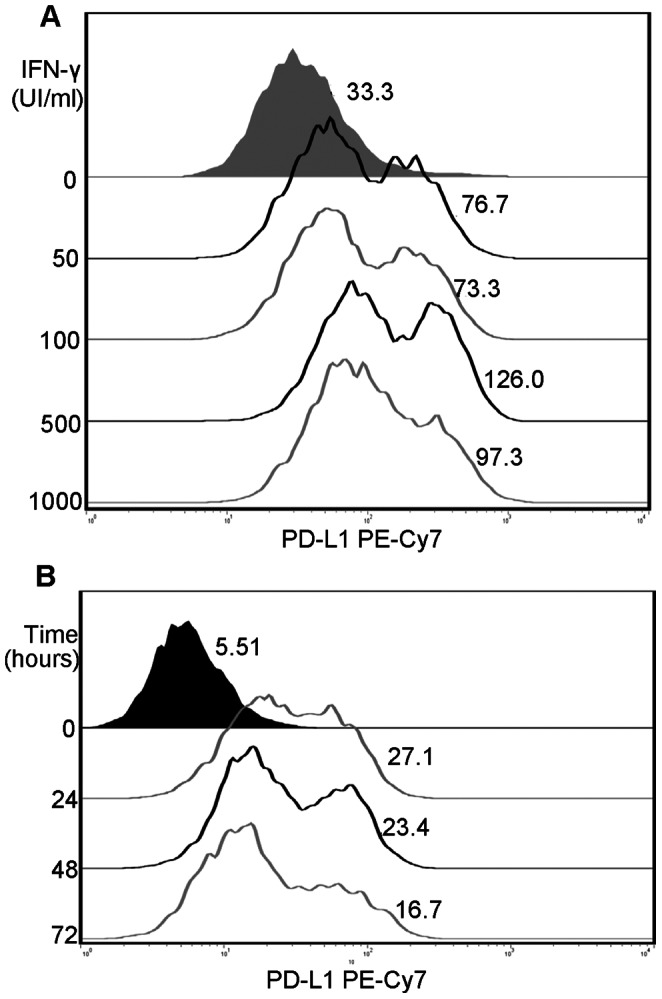
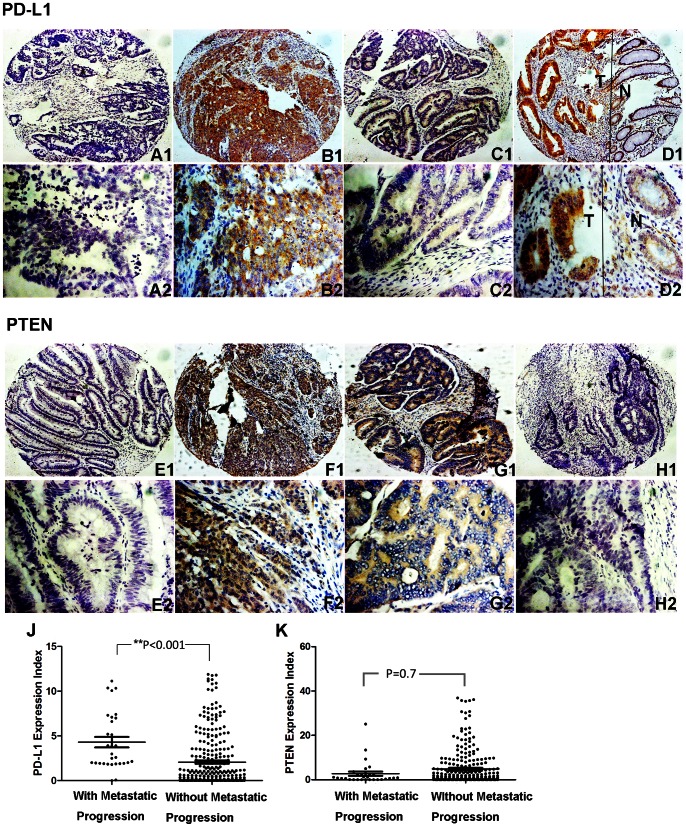
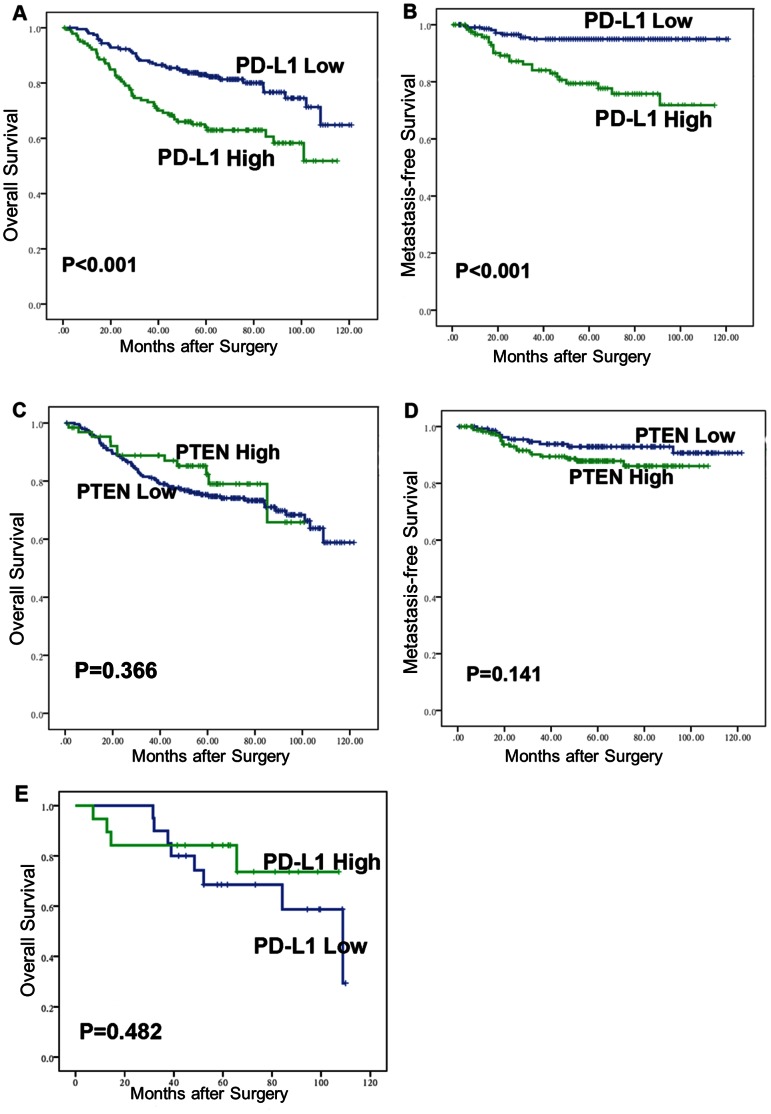
Methods/results: RNA interference approach was used to down-regulate PTEN expression in SW480, SW620 and HCT116 cells. It was showed that PD-L1 protein, but not mRNA, was significantly increased in cells transfected with siRNA PTEN compared with the negative control. Moreover, the capacity of PTEN to regulate PD-L1 expression was not obviously affected by IFN-γ, the main inducer of PD-L1. Tissue microarray immunohistochemistry was used to detect PD-L1 and PTEN in 404 CRC patient samples. Overexpression of PD-L1 was significantly correlated with distant metastasis (P<0.001), TNM stage (P<0.01), metastatic progression (P<0.01) and PTEN expression (P<0.001). Univariate analysis revealed that patients with high PD-L1 expression had a poor overall survival (P<0.001). However, multivariate analysis did not support PD-L1 as an independent prognostic factor (P = 0.548). Univariate (P<0.001) and multivariate survival (P<0.001) analysis of 310 located CRC patients revealed that high level of PD-L1 expression was associated with increased risks of metastatic progression. Furthermore, the clinical effect of PD-L1 on CRC was not statistically significant in a subset of 39 patients with no PTEN expression (distant metastasis: P = 0.102; TNM stage: P = 0.634, overall survival: P = 0.482).

Conclusions: PD-L1 can be used to identify CRC patients with high risk of metastasis and poor prognosis. This clinical manifestation may be partly associated with PTEN expression.


Conflict of interest statement

Competing Interests: The authors have declared that no competing interests exist.

Figures

Figure 1
Figure 1. Not PTEN loss but IFN-γ induced PD-L1 mRNA expression in CRC cell lines.
(A) The relative expression level of PTEN mRNA (detected by qRT-PCR, calculated by 2−ΔΔCT method) in four groups: cells transfected with siRNA PTEN or non-specific sequences in the presence or absence of IFN-γ. (B) The relative expression level of PD-L1 mRNA in four groups of cells. Data were collected from three independent experiments. Error bars represent SD.
Figure 2
Figure 2. PTEN knockdown increased Akt activation both in the presence and absence of IFN-γ.
The protein expression level of PTEN, Akt and phospho-AktSer473 were determined by Western blotting. β-actin was used to verify equal loading. Representative images are selected from performed experiments repeated in triplicates.
Figure 3
Figure 3. Effect of IFN-γ and PTEN loss on the expression of PD-L1 protein.
PD-L1 protein expression level on the surface of SW480, SW620 and HCT116 was determined by flow cytometer: cells transfected with siRNA PTEN (red lines) and cells transfected with non-specific sequences (blue lines) in the absence of IFN-γ; cells transfected with siRNA PTEN (black lines) and cells transfected with non-specific sequences (orange lines) in the presence of IFN-γ; cells stained with isotype-matched control antibody (shaded area). Standard fluorescence intensity of PD-L1 protein was described by histogram in right panel: cells treated (white column) or untreated (gray column) with IFN-γ. Data were collected from three independent experiments. Error bars represent SD. (*P<0.05 by paired-samples t test).
Figure 4
Figure 4. Dosage-course and time-course effect of IFN-γ on PD-L1 in SW480.
(A) SW480 treated with IFN-γ at indicated concentration (0 IU/ml, 50 IU/ml, 100 IU/ml, 500 IU/ml, 1000 IU/ml). (B) SW480 treated with 500 IU/ml IFN-γ for indicted times (0 h, 24 h, 48 h, and 72 h). Shaded area represents SW480 without treatment of IFN-γ, and numbers next to peaks represent standard fluorescence intensity of PD-L1. Representative images are selected from performed experiments repeated in triplicates.
Figure 5
Figure 5. Representative Immunohistochemical results of PD-L1/PTEN for patients with and without metastatic progression.
(A1, A2, E1, E2) Negative control; (B1, B2, F1, F2) Specimens from the same patient with metastatic progression; (C1, C2, G1, G2) Specimens from another patient without metastatic progression; (D1, D2) A typical representative which showed that PD-L1 expression is elevated in the tumor area (T) compared with those of adjacent normal mucosa (N); (H1, H2) Specimens from patient without any PTEN expression; (J, K) Statistical analysis demonstrated that PD-L1 expression is increased in the patients with metastatic progression compared with those without metastatic progression, while such statistical analysis of PTEN wasn’t significant. (Two up panels, stained with PD-L1 antibody; two down panels, stained with PTEN antibody), (A1–H1, ×100; A2–H2, ×400).
Figure 6
Figure 6. Association of PD-L1/PTEN expression with overall survival (OS) and metastasis-free survival (MFS) in 347 CRC patients.
(A, B) The OS and MFS were significantly lower in PD-L1-higher-expression patients compared with PD-L1-lower-expression patients (both P<0.001). (C, D) The OS and MFS were not significantly different between the PTEN-higher-expression patients and the PTEN-lower-expression patients (OS, P = 0.366; MFS, P = 0.141). (E) In the subset of 39 patients with complete PTEN loss, PD-L1 expression was no longer associated with the OS (P = 0.482).

References

    1. Jemal A, Bray F (2011) Center MM, Ferlay J, Ward E, et al (2011) Global cancer statistics. CA Cancer J Clin 61: 69–90. - PubMed
    1. Bretthauer M (2010) Evidence for colorectal cancer screening. Best Pract Res Clin Gastroenterol 24: 417–425. - PubMed
    1. Zou W, Chen L (2008) Inhibitory B7-family molecules in the tumour microenvironment. Nat Rev Immunol 8: 467–477. - PubMed
    1. Keir ME, Butte MJ, Freeman GJ, Sharpe AH (2008) PD-1 and its ligands in tolerance and immunity. Annu Rev Immunol 26: 677–704. - PMC - PubMed
    1. Yamazaki T, Akiba H, Iwai H, Matsuda H, Aoki M, et al. (2002) Expression of programmed death 1 ligands by murine T cells and APC. J Immunol 169: 5538–5545. - PubMed

Publication types

MeSH terms