

Retinal image quality during accommodation
- PMID: 23786386
- PMCID: PMC3700370
- DOI: 10.1111/opo.12075
Retinal image quality during accommodation
Abstract
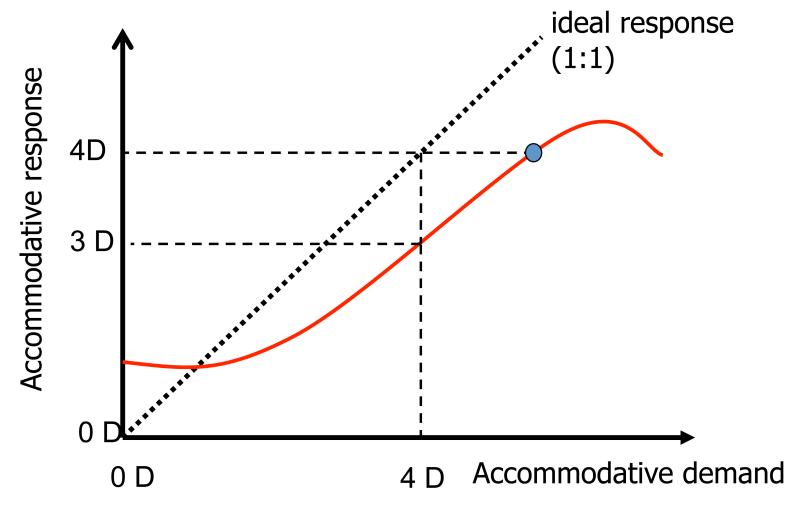
Purpose: We asked if retinal image quality is maximum during accommodation, or sub-optimal due to accommodative error, when subjects perform an acuity task.
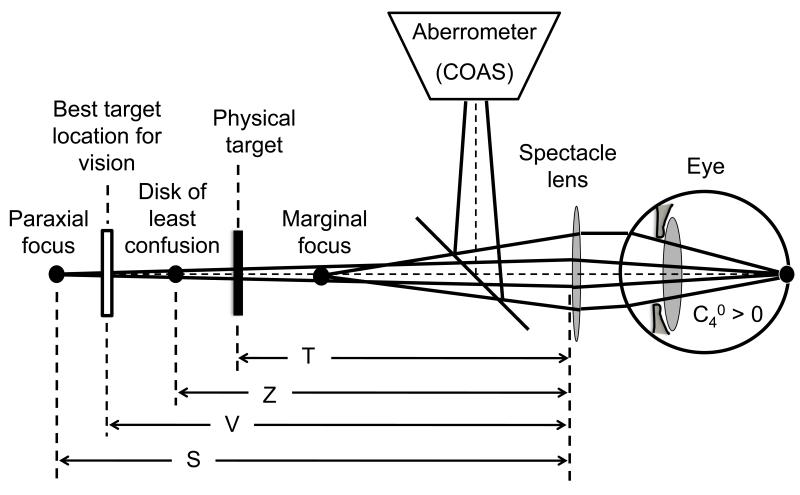
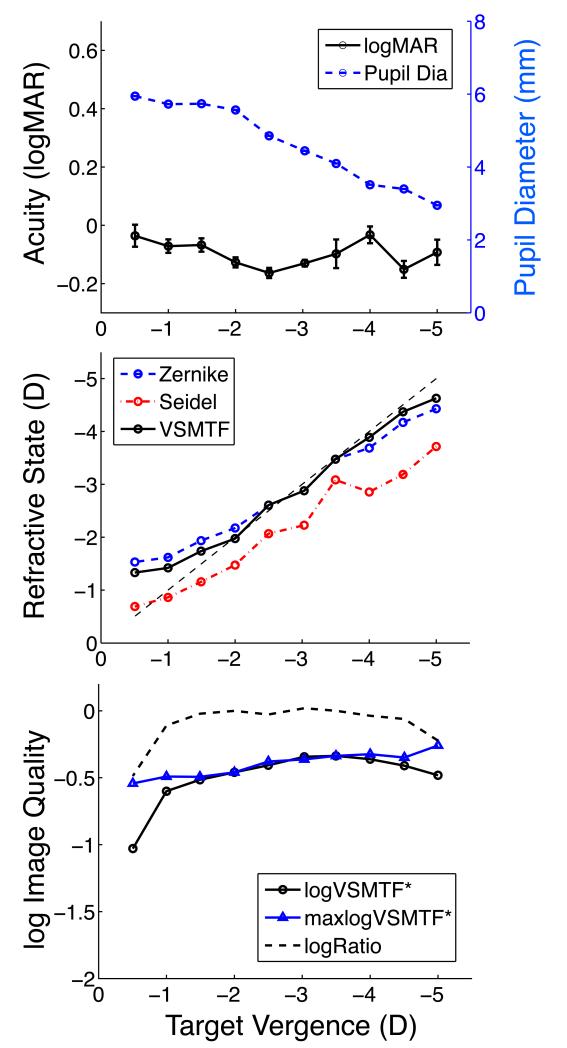
Methods: Subjects viewed a monochromatic (552 nm), high-contrast letter target placed at various viewing distances. Wavefront aberrations of the accommodating eye were measured near the endpoint of an acuity staircase paradigm. Refractive state, defined as the optimum target vergence for maximising retinal image quality, was computed by through-focus wavefront analysis to find the power of the virtual correcting lens that maximizes visual Strehl ratio.
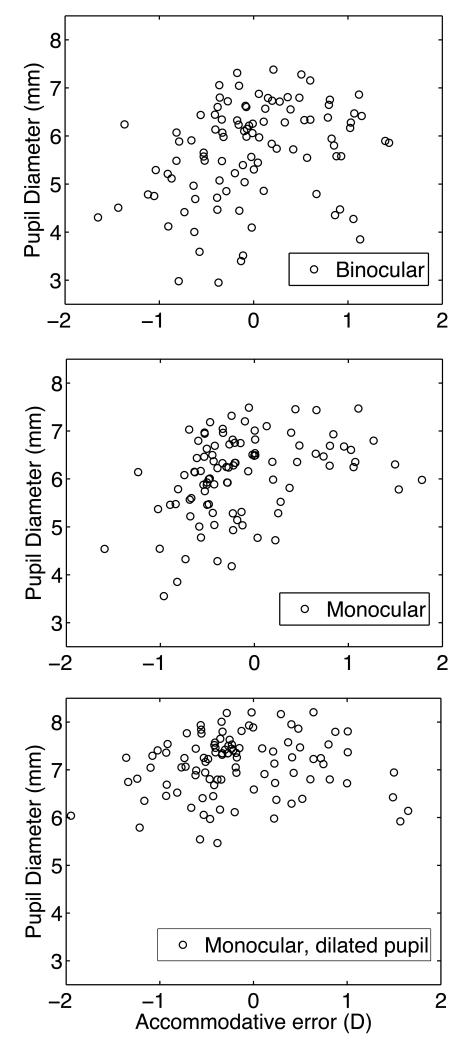
Results: Despite changes in ocular aberrations and pupil size during binocular viewing, retinal image quality and visual acuity typically remain high for all target vergences. When accommodative errors lead to sub-optimal retinal image quality, acuity and measured image quality both decline. However, the effect of accommodation errors of on visual acuity are mitigated by pupillary constriction associated with accommodation and binocular convergence and also to binocular summation of dissimilar retinal image blur. Under monocular viewing conditions some subjects displayed significant accommodative lag that reduced visual performance, an effect that was exacerbated by pharmacological dilation of the pupil.
Conclusions: Spurious measurement of accommodative error can be avoided when the image quality metric used to determine refractive state is compatible with the focusing criteria used by the visual system to control accommodation. Real focusing errors of the accommodating eye do not necessarily produce a reliably measurable loss of image quality or clinically significant loss of visual performance, probably because of increased depth-of-focus due to pupil constriction. When retinal image quality is close to maximum achievable (given the eye's higher-order aberrations), acuity is also near maximum. A combination of accommodative lag, reduced image quality, and reduced visual function may be a useful sign for diagnosing functionally-significant accommodative errors indicating the need for therapeutic intervention.
© 2013 The Authors Ophthalmic & Physiological Optics © 2013 The College of Optometrists.
Figures


References
-
- Charman WN. The eye in focus: accommodation and presbyopia. Clinical & experimental optometry: journal of the Australian Optometrical Association. 2008;91(3):207–25. Epub 2008/03/14. - PubMed
-
- Ciuffreda KJ. Accommodation and its anomalies. In: Cronly-Dillon J, editor. Vision and Visual Dysfunction. CRC press; London: 1991. pp. 231–79.
-
- Subbaram MV, Bullimore MA. Visual acuity and the accuracy of the accommodative response. Ophthalmic & physiological optics: the journal of the British College of Ophthalmic Opticians. 2002;22(4):312–8. Epub 2002/08/07. - PubMed
-
- Johnson CA. Effects of luminance and stimulus distance on accommodation and visual resolution. J Opt Soc Am. 1976;66(2):138–42. Epub 1976/02/01. - PubMed
-
- Luckiesh M, Moss F. The Variation in Visual Acuity with Fixation-Distance. J Opt Soc Am. 1941;31:594–5.
Publication types
MeSH terms
Grants and funding
LinkOut - more resources
Full Text Sources
Other Literature Sources
