

Herbarium specimens reveal the footprint of climate change on flowering trends across north-central North America
- PMID: 23786499
- PMCID: PMC3806244
- DOI: 10.1111/ele.12135
Herbarium specimens reveal the footprint of climate change on flowering trends across north-central North America
Abstract
Shifting flowering phenology with rising temperatures is occurring worldwide, but the rarity of co-occurring long-term observational and temperature records has hindered the evaluation of phenological responsiveness in many species and across large spatial scales. We used herbarium specimens combined with historic temperature data to examine the impact of climate change on flowering trends in 141 species collected across 116,000 km(2) in north-central North America. On average, date of maximum flowering advanced 2.4 days °C(-1), although species-specific responses varied from - 13.5 to + 7.3 days °C(-1). Plant functional types exhibited distinct patterns of phenological responsiveness with significant differences between native and introduced species, among flowering seasons, and between wind- and biotically pollinated species. This study is the first to assess large-scale patterns of phenological responsiveness with broad species representation and is an important step towards understanding current and future impacts of climate change on species performance and biodiversity.
Keywords: Climate change; invasive species; life history; phenological responsiveness; phenology; pollination syndrome.
© 2013 The Authors. Ecology Letters published by John Wiley & Sons Ltd and CNRS.
Figures
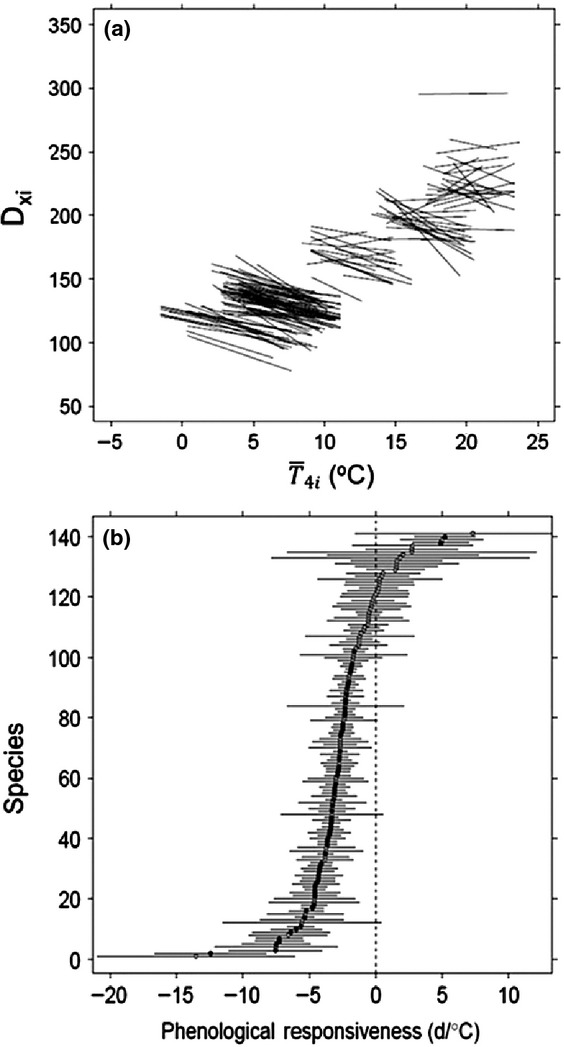
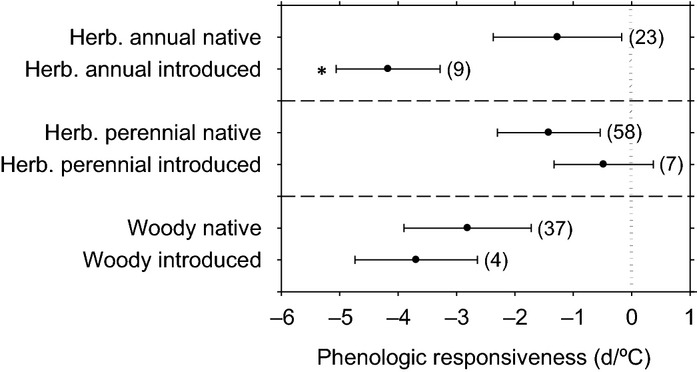
 . The slope of each line quantifies the phenological responsiveness for each species. (b) Rank order of each species’ phenological responsiveness is represented by a point ± SE bars. Closed points show a significant (P ≤ 0.05) phenological response to temperature, while open points designate no significant change. The dashed line indicates 0, or no phenological response. A negative phenological responsiveness indicates earlier flowering with warming while a positive shift represents delayed flowering with warming.
References
-
- Abu-Asab MS, Peterson PM, Shetler SG, Orli SS. Earlier plant flowering in spring as a response to global warming in the Washington, DC, area. Biodivers. Conserv. 2001;10:597–612.
-
- Bates D, Maechler M, Bolker B. lme4: Linear Mixed-Effects Models Using S4 Classes, R Package Version 0.999999-0. 2012. Available at: http://CRAN.R-project.org/package=lme4. Last accessed 14 August 2012.
-
- Bolmgren K, Eriksson O, Linder HP. Contrasting flowering phenology and Species richness in abiotically and biotically pollinated angiosperms. Evolution. 2003;57:2001–2011. - PubMed
-
- Culley TM, Weller SG, Sakai AK. The evolution of wind pollination in angiosperms. Trends Ecol. Evol. 2002;17:361–369.
-
- Elzinga JA, Atlan A, Biere A, Gigord L, Weis AE, Bernasconi G. Time after time: flowering phenology and biotic interactions. Trends Ecol. Evol. 2007;22:432–439. - PubMed
Publication types
MeSH terms
LinkOut - more resources
Full Text Sources
Other Literature Sources
Medical
