. 2013 Aug 1;73(15):4830-9.
doi: 10.1158/0008-5472.CAN-12-3504. Epub 2013 Jun 20.

Transcription poisoning by Topoisomerase I is controlled by gene length, splice sites, and miR-142-3p

Affiliations

Transcription poisoning by Topoisomerase I is controlled by gene length, splice sites, and miR-142-3p

Stéphanie Solier et al. Cancer Res. .

Abstract

Topoisomerase I (Top1) relaxes DNA supercoiling by forming transient cleavage complexes (Top1cc) up- and downstream of transcription complexes. Top1cc can be trapped by carcinogenic and endogenous DNA lesions and by camptothecin, resulting in transcription blocks. Here, we undertook genome-wide analysis of camptothecin-treated cells at exon resolution. RNA samples from HCT116 and MCF7 cells were analyzed with the Affy Exon Array platform, allowing high-resolution mapping along 18,537 genes. Long genes that are highly expressed were the most susceptible to downregulation, whereas short genes were preferentially upregulated. Along the body of genes, downregulation was most important toward the 3'-end and increased with the number of exon-intron junctions. Ubiquitin and RNA degradation-related pathway genes were selectively downregulated. Parallel analysis of microRNA with the Agilent miRNA microarray platform revealed that miR-142-3p was highly induced by camptothecin. More than 10% of the downregulated genes were targets of this p53-dependent microRNA. Our study shows the profound impact of Top1cc on transcription elongation, especially at intron-exon junctions and on transcript stability by microRNA miR-142-3p upregulation.


Conflict of interest statement

No conflict of interest

Figures

Figure 1
Figure 1
Experimental protocol and global impact of Top1 poisoning. A, Experimental design. Cells were treated with 10 µM CPT for 1, 2, 4, 15 and 20 h. Control samples received vehicle alone (0.1% DMSO, 4 and 20 h). B, Down-regulated and up-regulated genes (2-fold or more) in CPT-treated HCT116 cells. C, Down-regulated and up-regulated genes (2-fold or more) in CPT-treated MCF7 cells.
Figure 2
Figure 2
Effect of Top1 poisoning on gene expression is correlated with the basal gene expression level. A, Down-regulation of highly expressed genes by CPT. The basal expression level for a specific gene corresponded to the average between the log2 expression value for the controls (4 and 20 h DMSO treatment). The genes in the array were ranked according to transcripts levels. Genes were divided in 10 groups of same size depending of their basal expression level (~1745 genes by group). Then we determined the proportion of down-regulated genes in each group. The x-axis corresponds to the average basal expression level for each of the ten groups of genes. The y-axis corresponds to the number of down-regulated genes in each group. Upper panel: plot for the 217 “early” down-regulated genes (down-regulated within 4 h of CPT exposure). Lower panel: plot for the 3759 “late” down-regulated genes (down-regulated after CPT 15 h and/or 20 h). Correlation coefficients (r) are indicated. B, Up-regulation of low expression genes. The basal expression level for a specific gene corresponded to the average between the log2 expression values for the controls (4 and 20 h DMSO treatment). The genes in the array were ranked according to transcripts levels. Genes were divided in 10 groups of same size depending of their basal expression level (~1745 genes by group). Then we determined the proportion of up-regulated genes in each group. The×axis corresponds to the average basal expression level for each of the ten groups of genes. The y axis corresponds to the number of up-regulated genes in each group. Upper panel: plot for the 131 “early” up-regulated genes (up-regulated within 4 h of CPT exposure). Lower panel: plot for the 810 “late” up-regulated genes (up-regulated after CPT 15 h and/or 20 h). Correlation coefficients (r) are indicated.
Figure 3
Figure 3
Effect of Top1 poisoning on gene expression is correlated with gene length. A, Distribution of the down-regulated, up-regulated genes and all the genes of the array depending of their gene length. The down-regulated genes (3808), the up-regulated genes (835) and all the genes of the array (18537 genes) are represented in green, red and black, respectively. B, Median and average of gene length (in bases) for the down-regulated genes, the up-regulated genes and all the genes of the array.
Figure 4
Figure 4
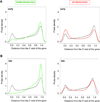
Transcripts are differentially affected along the length of genes. A, Distribution of the top 10000 differentially expressed probes (5770 down-regulated probes in green, 4230 up-regulated probes in red) at early times treatment with CPT depending of their distance from the 5’ end of the gene. The distribution of the 10,000 random probes is represented in black. The differential analysis was done with R package LIMMA (see materials and methods). B, Distribution of the top 10,000 differentially expressed probes (9233 down-regulated probes in green, 767 up-regulated probes in red) at late times treatment with CPT depending of their distance from the 5’ end of the gene. The distribution of 10,000 random probes is represented in black. The differential analysis was done with R package LIMMA (see materials and methods).
Figure 5
Figure 5
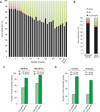
Preferential down-regulation of genes with numerous exon-intron junctions. A, The x-axis corresponds to the number of exons. The y-axis corresponds to the proportion of down-regulated genes (in green) or up-regulated genes (in red) and unchanged genes (in black) among the genes with a determined number of exons. B, Intronless genes have a higher probability to be up-regulated than down-regulated. Proportion of down-regulated genes, up-regulated genes and unchanged genes in intronless genes or in introns-containing genes are represented in green, red and black, respectively. C, Same length genes have a higher probability to be down-regulated when they have large number of exons. The number of down-regulated genes for two groups of same size genes, that differ only by the number of exons (a group with lower number of exons, a second group with a larger number of exons) is plotted in green. D, Same exons number genes have a higher probability to be down-regulated if they are long. The number of down-regulated genes for two groups of genes with the same exons number, but differing by gene length (a group with short genes, a second group with long genes) is plotted in green.
Figure 6
Figure 6
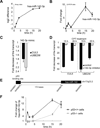
miR-142-3p up-regulation is responsible for gene down-regulation in response to CPT treatment. A, Agilent miRNA microarray data for hsa-miR-142-3p expression after CPT treatment. The log2 difference for hsa-miR-142-3p expression depending on CPT treatment normalized to the untreated controls. B, hsa-miR-142-3p up-regulation after CPT treatment. hsa-miR-142-3p was analyzed by Q-PCR. C, hsa-miR-142-3p mimic down-regulates CUL5 and UBE2W transcripts. HCT116 cells transfected with hsa-miR-142-3p mimic or negative control were treated with CPT (10 µM, 15 h or 20 h). CUL5 and UBE2W transcripts were analyzed by Q-RT-PCR. The y-axis corresponds to the fold decrease of CUL5 (black bar) or UBE2W (gray bar) after CPT treatment (15 h or 20 h) compared to control. D, The hsa-miR-142-3p inhibitor counteracts the down-regulation of CUL5 and UBE2W transcripts. HCT116 cells transfected with the hsa-miR-142-3p inhibitor or miScript inhibitor negative control were treated with CPT (10 µM, 15 h or 20 h). CUL5 and UBE2W transcripts were analyzed by Q-RT-PCR. The y-axis corresponds to the fold decrease of CUL5 (left panel) or UBE2W (right panel) after CPT treatment (15 h or 20 h) compared to control. The black bars correspond to inhibitor negative control, and the gray bars correspond to hsa-miR-142-3p inhibitor. E, Schematic representation of hsa-miR-142 and its flanking region showing its p53 binding site. F, miR-142-3p up-regulation after CPT treatment is p53 dependent. p53+/+ and p53−/− HCT116 cells were treated with CPT (10 µM, 1 h, 2 h, 4 h, 15 h or 20 h).. hsa-miR-142-3p was analyzed by Q-PCR. p53+/+ HCT116 cells are in black and p53−/− HCT116 cells are in gray.

References

    1. Pommier Y. Topoisomerase I inhibitors: camptothecins and beyond. Nat Rev Cancer. 2006;6:789–802. - PubMed
    1. Pommier Y. DNA topoisomerase I inhibitors: chemistry, biology, and interfacial inhibition. Chem Rev. 2009;109:2894–2902. - PMC - PubMed
    1. Hsiang YH, Hertzberg R, Hecht S, Liu LF. Camptothecin induces protein-linked DNA breaks via mammalian DNA topoisomerase I. J Biol Chem. 1985;260:14873–14878. - PubMed
    1. Ljungman M, Hanawalt PC. The anti-cancer drug camptothecin inhibits elongation but stimulates initiation of RNA polymerase II transcription. Carcinogenesis. 1996;17:31–35. - PubMed
    1. Seiler JA, Conti C, Syed A, Aladjem MI, Pommier Y. The Intra-S-Phase Checkpoint Affects both DNA Replication Initiation and Elongation: Single-Cell and - DNA Fiber Analyses. Mol Cell Biol. 2007;27:5806–5818. - PMC - PubMed

Publication types

MeSH terms