

A comparison of methods for analyzing time series of pulsatile hormone data
- PMID: 23787487
- PMCID: PMC4535452
- DOI: 10.1002/sim.5882
A comparison of methods for analyzing time series of pulsatile hormone data
Abstract
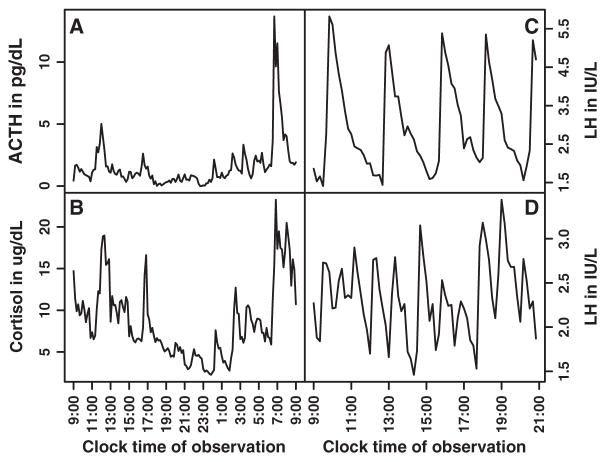
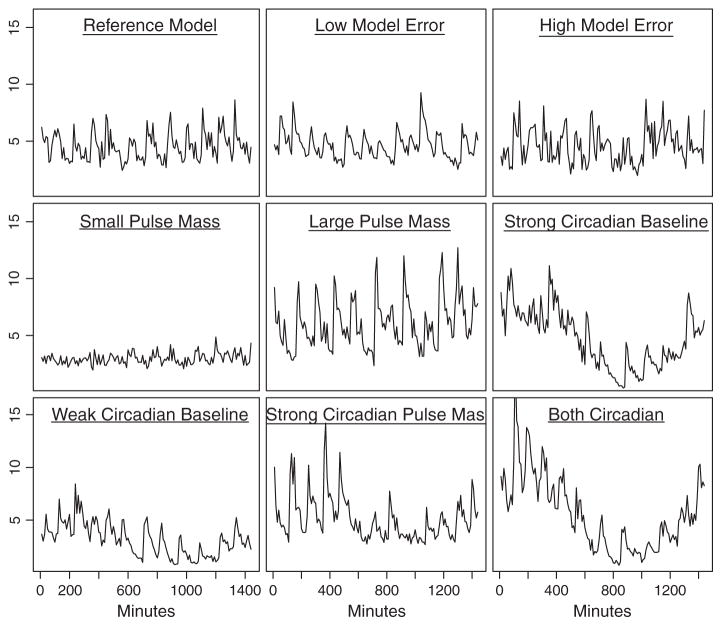
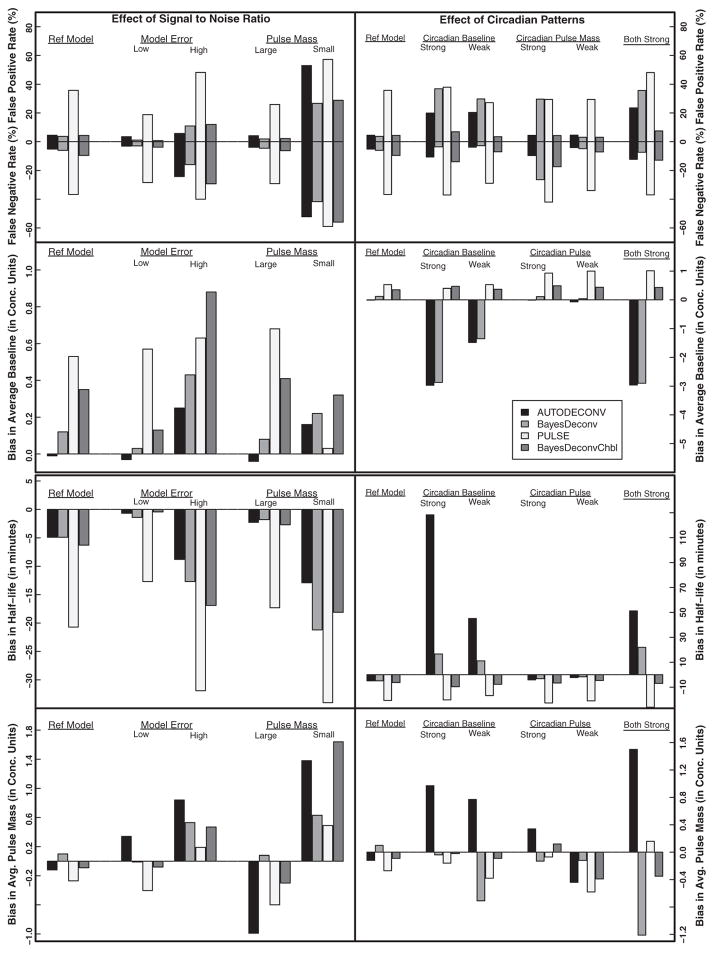
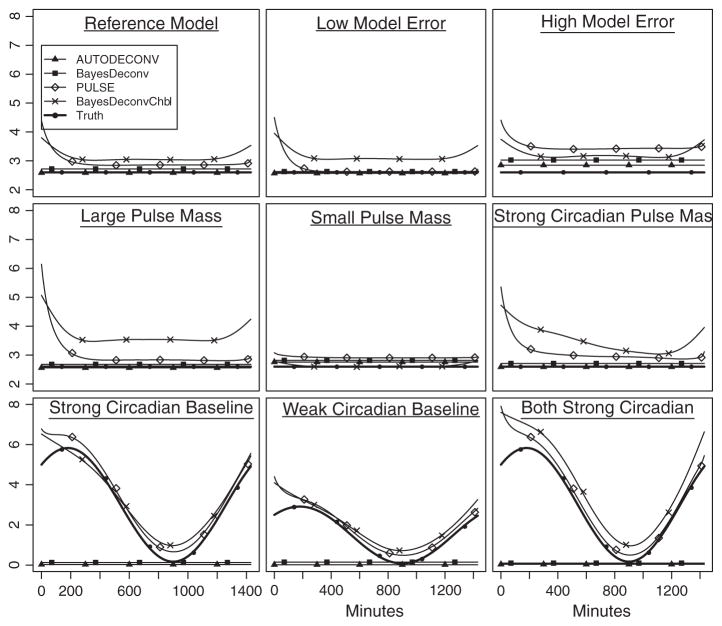
Many endocrine systems are regulated by pulsatile hormones - hormones that are secreted intermittently in boluses rather than continuously over time. To study pulsatile secretion, blood is drawn every few minutes for an extended period. The result is a time series of hormone concentrations for each individual. The goal is to estimate pulsatile hormone secretion features such as frequency, location, duration, and amount of pulsatile and non-pulsatile secretion and compare these features between groups. Various statistical approaches to analyzing these data have been proposed, but validation has generally focused on one hormone. Thus, we lack a broad understanding of each method's performance. By using simulated data with features seen in reproductive and stress hormones, we investigated the performance of three recently developed statistical approaches for analyzing pulsatile hormone data and compared them to a frequently used deconvolution approach. We found that methods incorporating a changing baseline modeled both constant and changing baseline shapes well; however, the added model flexibility resulted in a slight increase in bias in other model parameters. When pulses were well defined and baseline constant, Bayesian approaches performed similar to the existing deconvolution method. The increase in computation time of Bayesian approaches offered improved estimation and more accurate quantification of estimation variation in situations where pulse locations were not clearly identifiable. Within the class of deconvolution models for fitting pulsatile hormone data, the Bayesian approach with a changing baseline offered adequate results over the widest range of data.
Keywords: Bayesian; birth-and-death MCMC; deconvolution; model validation; simulation; spline.
Copyright © 2013 John Wiley & Sons, Ltd.
Figures
Similar articles
-
Bayesian analysis improves pulse secretion characterization in reproductive hormones.Syst Biol Reprod Med. 2018 Feb;64(1):80-91. doi: 10.1080/19396368.2017.1411541. Epub 2017 Dec 29. Syst Biol Reprod Med. 2018. PMID: 29287490 Free PMC article.
-
A Bayesian approach to modeling associations between pulsatile hormones.Biometrics. 2009 Jun;65(2):650-9. doi: 10.1111/j.1541-0420.2008.01117.x. Biometrics. 2009. PMID: 18759850 Free PMC article.
-
Bayesian deconvolution analysis of pulsatile hormone concentration profiles.Biometrics. 2003 Sep;59(3):650-60. doi: 10.1111/1541-0420.00075. Biometrics. 2003. PMID: 14601766
-
Analyzing pulsatile endocrine data in patients with chronic renal failure: a brief review of deconvolution techniques.Pediatr Nephrol. 1991 Jul;5(4):522-8. doi: 10.1007/BF01453694. Pediatr Nephrol. 1991. PMID: 1911132 Review.
-
Motivations and methods for analyzing pulsatile hormone secretion.Endocr Rev. 2008 Dec;29(7):823-64. doi: 10.1210/er.2008-0005. Epub 2008 Oct 21. Endocr Rev. 2008. PMID: 18940916 Free PMC article. Review.
Cited by
-
A population-based approach to analyzing pulses in time series of hormone data.Stat Med. 2017 Jul 20;36(16):2576-2589. doi: 10.1002/sim.7292. Epub 2017 Apr 9. Stat Med. 2017. PMID: 28393373 Free PMC article.
-
Bayesian analysis improves pulse secretion characterization in reproductive hormones.Syst Biol Reprod Med. 2018 Feb;64(1):80-91. doi: 10.1080/19396368.2017.1411541. Epub 2017 Dec 29. Syst Biol Reprod Med. 2018. PMID: 29287490 Free PMC article.
References
-
- Sherwood L. Fundamentals of Human Physiology: A Human Perspective. 3. Brooks-Cole; Belmont, CA: 2005.
-
- Greenspan FS, Gardner DG. Basic and Clinical Endocrinology. 7. McGraw-Hill; New York: 2004.
-
- Carroll BJ, Curtis GC, Mendels J. Neuroendocrine regulation in depression I. Limbic system-adrenocortical dysfunction. Archives of General Psychiatry. 1976;33:1039–1044. - PubMed
-
- Carroll BJ, Curtis GC, Mendels J. Neuroendocrine regulation in depression II. Discrimination of depressed and nondepressed patients. Archives of General Psychiatry. 1976;33:1051–1058. - PubMed
Publication types
MeSH terms
Substances
Grants and funding
LinkOut - more resources
Full Text Sources
Other Literature Sources
Medical