. 2013 Jun 17;21(12):14816-31.
doi: 10.1364/OE.21.014816.

Cytometric sorting based on the fluorescence lifetime of spectrally overlapping signals

Affiliations

Cytometric sorting based on the fluorescence lifetime of spectrally overlapping signals

Ruofan Cao et al. Opt Express. .

Abstract

Flow cytometry is a well-established and powerful high- throughput fluorescence measurement tool that also allows for the sorting and enrichment of subpopulations of cells expressing unique fluorescence signatures. Owing to the reliance on intensity-only signals, flow cytometry sorters cannot easily discriminate between fluorophores that spectrally overlap. In this paper we demonstrate a new method of cell sorting using a fluorescence lifetime-dependent methodology. This approach, referred to herein as phase-filtered cell sorting (PFCS), permits sorting based on the average fluorescence lifetime of a fluorophore by separating fluorescence signals from species that emit differing average fluorescence lifetimes. Using lifetime-dependent hardware, cells and microspheres labeled with fluorophores were sorted with purities up to 90%. PFCS is a practical approach for separating populations of cells that are stained with spectrally overlapping fluorophores or that have interfering autofluorescence signals.


Figures

Fig. 1
Fig. 1
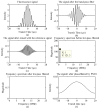
Illustration of signal processing electronics and different stages required for phase-filtered cell sorting. A modulated Gaussian signal (solid black line) is input into stage 1; see also Eq. (7). After band-pass filtering this signal, stage 2 represents the “cleaned” and total fluorescence signal. The total signal is split in half and each half is mixed with separate phase-delayed reference signals (shown as a single sinusoidal input as solid black line) represented by Eq. (8) and (9). At stage 3, the output of each mixed signal represented by Eqs. (10) and (11) are then low-pass filtered. The final phase-sensitive fluorescence signals at stage 4 are delivered to a flow cytometry data acquisition system for routine analysis or sorting. The outputs after stage 4 are signals from Dye #1 (blue line) and Dye #2 (red line). The different stages are also simulated and exemplified in Fig. 3.
Fig. 2
Fig. 2
Simplified diagram of the PFCS system. Fluorescently labeled particles or cells rapidly transit a modulated laser beam during hydrodynamic focusing. The fluorescence and side scattered light are focused onto photomultiplier tube detectors. Signals from the PMTs are collected and routed to the PFCS hardware. A box represents all PFCS hardware, which are depicted in detail by Fig. 1. After phase-filtering, the signals are connected to the cytometry data system and normal sorting is accomplished. Sorting is based upon the formation of droplets and the selective charging of each droplet based on the phase-sensitive parameter. Once charged the droplets are attracted to either positively or negatively charged plates to be collected into separate vials. All sorting gates are set on the cytometry computer after the phase filtering is performed.
Fig. 3
Fig. 3
Simulation results at each stage during phase-resolved detection (see also Fig. 1 for each stage) where (a) is the total fluorescence signal from a mixture of two spectrally overlapping fluorophores (Eq. (7)) when the modulation frequency is 1 MHz. After band-pass filtering of this signal (b), the fluorescence signal is mixed with a 1-MHz phase-shifted reference signal (c). Simulation of low-pass filtering is a 3-stage process. First, a Fast Fourier Transform of (c) results in (d), where the 1-MHz high frequency from the FFT output is revealed. Then low pass filtering of (d) results in (e), where the 1-MHz peak is eliminated. Finally, an inverse FFT of (e) is accomplished to collect the final phase-sensitive signal (f).
Fig. 4
Fig. 4
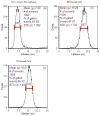
Cytometric histograms displaying the number of fluorescence microspheres or cells having a measured fluorescence lifetime. Measurements were made with a modified FACSVantage SE digital lifetime cytometer. (a) Fluorescence lifetime histogram of Flow-Check fluorospheres, which is an average of 7 ns. The standard deviation of the fluorescence lifetime measured in this population is 1.302 ns. (b) Fluorescence lifetime histogram of EB stained cells. The mean fluorescence lifetime is 19.28 ns with 1.733 standard deviation (STD). (c) Fluorescence lifetime histogram of PI stained cells. The mean lifetime is 16.07 ns with 1.490 STD
Fig. 5
Fig. 5
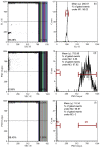
Histograms and dot plots representing the number of Flow-Check fluorospheres having a specific side-scatter intensity (SSC), fluorescence intensity (FL1-H), or phase-sensitive intensity (PSD) signal before and after the phase-filtering process. Panels (a) and (b) present typical scatter and fluorescence histograms to illustrate the presence and detectability of the fluorospheres on the PFCS system. Panels (c) and (d) are the PSD fluorescence intensity counts measured by the same cytometer after phase filtering to maximize the fluorosphere signal (i.e. cos(ϕ1ϕREF)=1). The dot plot shows the signal correlated to side scatter (SSC). Panels (e) and (f) are the PSD fluorescence intensity counts measured by the same cytometer after phase filtering to eliminate the fluorosphere signal (i.e. cos(ϕ1ϕREF)=0).
Fig. 6
Fig. 6
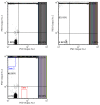
Dot plots of phase-resolved detection prior to sorting. The parameters plotted are PSD No.1 vs. PSD No.2 (see Fig. 1). In panels (a) and (b) Flow-Check fluorospheres and YG microspheres are measured separately with the PFCS system. Panel (a): PSD No.1 is used to null YG fluorescence so that only fluorescence from Flow-Check fluorospheres is detectable; this demonstrates that the Flow-Check fluorosphere signals remain. Panel (b): PSD No.2 is adjusted to null Flow-Check fluorospheres so only signals from YG microspheres are detectable. Panel (c) is a dot plot of the phase-resolved detection of a mixed sample. Dots in gate 1 are Flow-Check fluorospheres and dots in gate 2 represent individual YG microspheres when the respective PSD channels are nulled to result in only one type of fluorescence signal per channel.
Fig. 7
Fig. 7
Dot plots demonstrating separation of mixed fluorescence microspheres using PFCS. A BD Accuri flow cytometer was used to obtain the three plots where panel (a) is pre-sort Flow-Check fluorosphere and YG microsphere mixture, panel (b) and (c) display the number of separated YG and Flow-Check fluorospheres when PSFC was implemented. YG microspheres were purified to 90.64% and Flow-Check fluorospheres were purified to 91.70%.
Fig. 8
Fig. 8
Dot plot of two correlated parameters, PSD No.1 vs PSD No.2 (see Fig. 1), for a mixture of EB and PI stained cells. The events show counts in the respective PSD channels where channel No.1 contains only signals from the EB-labeled cells and channel No.2 contains fluorescence signals from only PI-labeled cells. The plot was obtained after adjusting the respective PSD channels to null the signal from either the PI- or EB-stained samples. Therefore dots in Gate 01 are EB stained cells, which are approximately 29.91% of the total population, and dots in Gate 02 are approximately 14.91% of the total population.
Fig. 9
Fig. 9
Dot plots showing populations of sorted EB- and PI-labeled cells using an analog fluorescence lifetime flow cytometer. Panel (a) displays example results of a population of cells with only ethidium bromide as the primary fluorescent label. Likewise, panel (b) displays the number of cells sorted that only contain PI as the primary fluorescence label.

Similar articles

Cited by

References

    1. Fulwyler M. J., “Electronic separation of biological cells by volume,” Science 150(3698), 910–911 (1965). 10.1126/science.150.3698.910 - DOI - PubMed
    1. Bonner W. A., Hulett H. R., Sweet R. G., Herzenberg L. A., “Fluorescence activated cell sorting,” Rev. Sci. Instrum. 43(3), 404–409 (1972). 10.1063/1.1685647 - DOI - PubMed
    1. Steinkamp J. A., Fulwyler M. J., Coulter J. R., Hiebert R. D., Horney J. L., Mullancy P. F., “A new multiparameter separator for microscopic particles and biological cells,” Rev. Sci. Instrum. 44(9), 1301–1310 (1973). 10.1063/1.1686375 - DOI - PubMed
    1. Jett J. H., Alexander R. G., “Droplet sorting of large particles,” Cytometry 6(5), 484–486 (1985). 10.1002/cyto.990060514 - DOI - PubMed
    1. Bartholdi M. F., Parson J. D., Albright K. A., Cram L. S., “System for flow sorting chromosomes on the basis of pulse shape,” Cytometry 11(1), 165–172 (1990). 10.1002/cyto.990110119 - DOI - PubMed

Publication types

MeSH terms