. 2013 Jul 21;58(14):4881-96.
doi: 10.1088/0031-9155/58/14/4881. Epub 2013 Jun 21.

The influence of sulcus width on simulated electric fields induced by transcranial magnetic stimulation

Affiliations

The influence of sulcus width on simulated electric fields induced by transcranial magnetic stimulation

A M Janssen et al. Phys Med Biol. .

Abstract

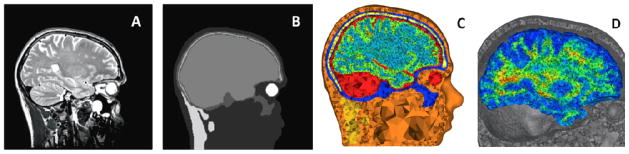
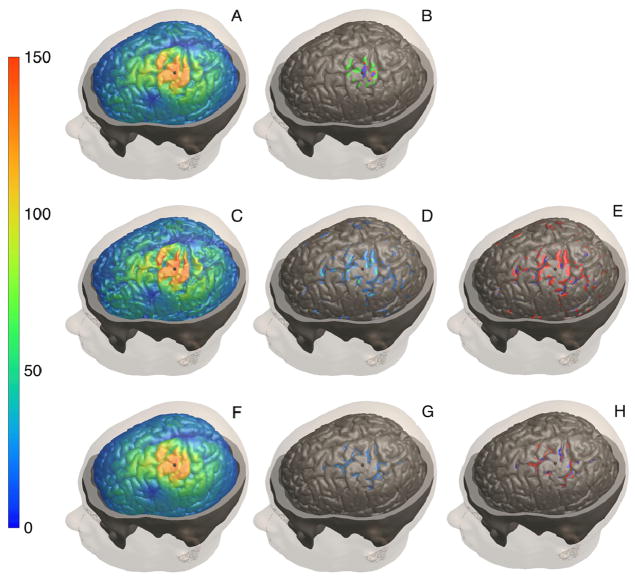
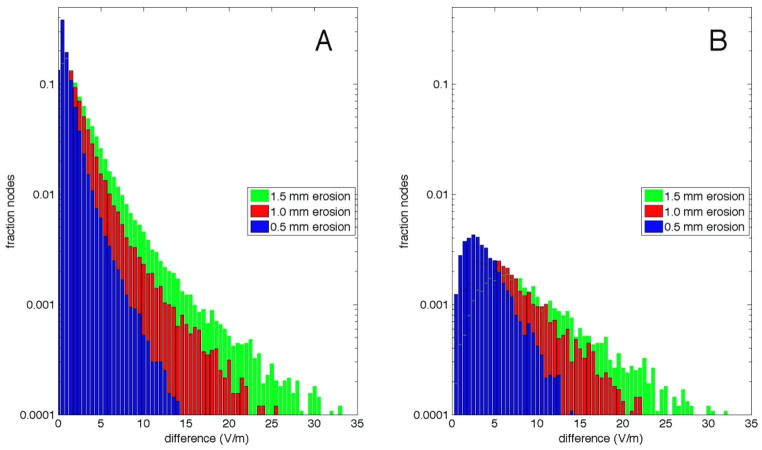
Volume conduction models can help in acquiring knowledge about the distribution of the electric field induced by transcranial magnetic stimulation. One aspect of a detailed model is an accurate description of the cortical surface geometry. Since its estimation is difficult, it is important to know how accurate the geometry has to be represented. Previous studies only looked at the differences caused by neglecting the complete boundary between cerebrospinal fluid (CSF) and grey matter (Thielscher et al 2011 NeuroImage 54 234-43, Bijsterbosch et al 2012 Med. Biol. Eng. Comput. 50 671-81), or by resizing the whole brain (Wagner et al 2008 Exp. Brain Res. 186 539-50). However, due to the high conductive properties of the CSF, it can be expected that alterations in sulcus width can already have a significant effect on the distribution of the electric field. To answer this question, the sulcus width of a highly realistic head model, based on T1-, T2- and diffusion-weighted magnetic resonance images, was altered systematically. This study shows that alterations in the sulcus width do not cause large differences in the majority of the electric field values. However, considerable overestimation of sulcus width produces an overestimation of the calculated field strength, also at locations distant from the target location.


Figures

Figure 1
Figure 1
(A) A sagittal cut plane of the T2w MRI showing the different skull layers. (B) The same sagittal cut plane of the manually corrected segmentation including skin, skull compacta, skull spongiosa, neck muscle, eyes and one compartment for inner skull (CSF, GM and WM, before segmentation with Freesurfer). (C) Sagittal cut plane of the final tetrahedral volume mesh created with TetGen. The different tissue types are represented with different colours. The corresponding bulk conductivities are given in Table 1. (D) Sagittal cut plane of the brain mesh with the fractional anisotropy on a scale from 0 (blue) to 1 (red). The maximal fractional anisotropy value in the brain is 0.99 and the minimum is 0.
Figure 2
Figure 2
The effect of erosion and expansion on a sulcus. In brown a sulcus of the standard model is shown, in green the sulcus of a 1.5 mm eroded surface and in blue the sulcus of a 1.5 mm expanded surface. All other alterations lie between these two boundaries.
Figure 3
Figure 3
(A) The electric field distributions (V/m) in a cross section of the standard model with brain anisotropy. The black lines show the boundaries between the CSF and the skull and the CSF and GM. (B) The same cross-section for an inhomogeneous brain with the bulk conductivity for GM and WM and (C) for a homogeneous brain with the GM bulk conductivity. Subsequently the cross-section for the anisotropic brain with (D) 0.5 mm erosion, (E) 1.0 mm erosion, (F) 1.5 mm erosion, (G) 0.5 mm expansion, (H) 1.0 mm expansion and (I) 1.5 mm expansion. In all panels the field strength is displayed on a scale from 0 to 150 V/m.
Figure 4
Figure 4
Top row: (A) The induced electric field (V/m) just below the cortical surface of the standard model and (B) the areas stimulated with more than 123 V/m for the 1.5 mm expanded model (blue), the standard model (red) and the 1.5 mm eroded model (green). Middle row: For the 1.5 mm eroded model, (C) the induced electric field (V/m), (D) the magnitude of the differences with the standard model and (E) the direction of the differences (red, the altered model has a higher electric field strength, blue the altered model has a lower electric field strength). Bottom row: For the 1.5 mm expanded model, (F) the induced electric field (V/m), (G) the magnitude of the differences with the standard model and (H) the direction of the differences. The differences in panels D, E, G and H are projected on the standard model surface. In panels (A, C, D, F & G) the field strength is displayed on a scale from 0 to 150 V/m.
Figure 5
Figure 5
Two logarithmic histogram plots that show the differences in electric field strength for the nodes of the cortical surface with eroded sulci compared to the standard cortical surface. Only differences up to 35 V/m (the far majority) are shown. (A) The differences between all comparable nodes in the standard model and the nodes in a model with 0.5 mm erosion (green), 1.0 mm erosion (red) and 1.5 mm erosion (blue). (B) The same comparison, but only for the nodes that are within a 30 mm radius of the cortical FDI hotspot.

Similar articles

Cited by

References

    1. Akhtari M, et al. Conductivities of three-layer live human skull. Brain topography. 2002;14(3):151–67. - PubMed
    1. Attene M. A lightweight approach to repairing digitized polygon meshes. The Visual Computer. 2010;26(11):1393–1406.
    1. Bijsterbosch JD, Barker AT, Lee K-H, Woodruff PWR. Where does transcranial magnetic stimulation (TMS) stimulate? Modelling of induced field maps for some common cortical and cerebellar targets. Medical & biological engineering & computing. 2012;50(7):671–681. - PubMed
    1. Braess D. Finite Elements: Theory, Fast Solvers and Applications in Solid Mechanics. Cambridge University Press; 2007.
    1. Chen M, Mogul DJ. A structurally detailed finite element human head model for simulation of transcranial magnetic stimulation. Journal of neuroscience methods. 2009;179(1):111–20. - PubMed

Publication types

LinkOut - more resources