Functional significance of glutamate-cysteine ligase modifier for erythrocyte survival in vitro and in vivo
- PMID: 23787995
- PMCID: PMC3770325
- DOI: 10.1038/cdd.2013.70
Functional significance of glutamate-cysteine ligase modifier for erythrocyte survival in vitro and in vivo
Abstract
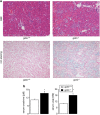
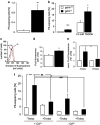
Erythrocytes endure constant exposure to oxidative stress. The major oxidative stress scavenger in erythrocytes is glutathione. The rate-limiting enzyme for glutathione synthesis is glutamate-cysteine ligase, which consists of a catalytic subunit (GCLC) and a modifier subunit (GCLM). Here, we examined erythrocyte survival in GCLM-deficient (gclm(-/-)) mice. Erythrocytes from gclm(-/-) mice showed greatly reduced intracellular glutathione. Prolonged incubation resulted in complete lysis of gclm(-/-) erythrocytes, which could be reversed by exogenous delivery of the antioxidant Trolox. To test the importance of GCLM in vivo, mice were treated with phenylhydrazine (PHZ; 0.07 mg/g b.w.) to induce oxidative stress. Gclm(-/-) mice showed dramatically increased hemolysis compared with gclm(+/+) controls. In addition, PHZ-treated gclm(-/-) mice displayed markedly larger accumulations of injured erythrocytes in the spleen than gclm(+/+) mice within 24 h of treatment. Iron staining indicated precipitations of the erythrocyte-derived pigment hemosiderin in kidney tubules of gclm(-/-) mice and none in gclm(+/+) controls. In fact, 24 h after treatment, kidney function began to diminish in gclm(-/-) mice as evident from increased serum creatinine and urea. Consequently, while all PHZ-treated gclm(+/+) mice survived, 90% of PHZ-treated gclm(-/-) mice died within 5 days of treatment. In vitro, upon incubation in the absence or presence of additional oxidative stress, gclm(-/-) erythrocytes exposed significantly more phosphatidylserine, a cell death marker, than gclm(+/+) erythrocytes, an effect at least partially due to increased cytosolic Ca(2+) concentration. Under resting conditions, gclm(-/-) mice exhibited reticulocytosis, indicating that the enhanced erythrocyte death was offset by accelerated erythrocyte generation. GCLM is thus indispensable for erythrocyte survival, in vitro and in vivo, during oxidative stress.
Figures


Similar articles
-
Initial characterization of the glutamate-cysteine ligase modifier subunit Gclm(-/-) knockout mouse. Novel model system for a severely compromised oxidative stress response.J Biol Chem. 2002 Dec 20;277(51):49446-52. doi: 10.1074/jbc.M209372200. Epub 2002 Oct 15. J Biol Chem. 2002. PMID: 12384496
-
Glutamate Cysteine Ligase Modifier Subunit (Gclm) Null Mice Have Increased Ovarian Oxidative Stress and Accelerated Age-Related Ovarian Failure.Endocrinology. 2015 Sep;156(9):3329-43. doi: 10.1210/en.2015-1206. Epub 2015 Jun 17. Endocrinology. 2015. PMID: 26083875 Free PMC article.
-
Glutamate cysteine ligase catalysis: dependence on ATP and modifier subunit for regulation of tissue glutathione levels.J Biol Chem. 2005 Oct 7;280(40):33766-74. doi: 10.1074/jbc.M504604200. Epub 2005 Aug 4. J Biol Chem. 2005. PMID: 16081425
-
Modulating GSH synthesis using glutamate cysteine ligase transgenic and gene-targeted mice.Drug Metab Rev. 2008;40(3):465-77. doi: 10.1080/03602530802186587. Drug Metab Rev. 2008. PMID: 18642143 Review.
-
Glutathione synthesis.Biochim Biophys Acta. 2013 May;1830(5):3143-53. doi: 10.1016/j.bbagen.2012.09.008. Epub 2012 Sep 17. Biochim Biophys Acta. 2013. PMID: 22995213 Free PMC article. Review.
Cited by
-
Siegesbeckiae Herba Extract and Chlorogenic Acid Ameliorate the Death of HaCaT Keratinocytes Exposed to Airborne Particulate Matter by Mitigating Oxidative Stress.Antioxidants (Basel). 2021 Nov 4;10(11):1762. doi: 10.3390/antiox10111762. Antioxidants (Basel). 2021. PMID: 34829633 Free PMC article.
-
Can the administration of platelet lysates to the brain help treat neurological disorders?Cell Mol Life Sci. 2022 Jun 24;79(7):379. doi: 10.1007/s00018-022-04397-w. Cell Mol Life Sci. 2022. PMID: 35750991 Free PMC article. Review.
-
Blunted apoptosis of erythrocytes in mice deficient in the heterotrimeric G-protein subunit Gαi2.Sci Rep. 2016 Aug 8;6:30925. doi: 10.1038/srep30925. Sci Rep. 2016. PMID: 27499046 Free PMC article.
-
Geniposidic Acid from Eucommia ulmoides Oliver Staminate Flower Tea Mitigates Cellular Oxidative Stress via Activating AKT/NRF2 Signaling.Molecules. 2022 Dec 5;27(23):8568. doi: 10.3390/molecules27238568. Molecules. 2022. PMID: 36500666 Free PMC article.
-
Identification of a Novel Ferroptosis-Related Gene Signature for Prediction of Prognosis in Bladder Urothelial Carcinoma.Bladder Cancer. 2022 Mar 11;8(1):19-34. doi: 10.3233/BLC-211522. eCollection 2022. Bladder Cancer. 2022. PMID: 38994521 Free PMC article.
References
-
- Beutler E, Moroose R, Kramer L, Gelbart T, Forman L. Gamma-glutamylcysteine synthetase deficiency and hemolytic anemia. Blood. 1990;75:271–273. - PubMed
-
- Pastore A, Federici G, Bertini E, Piemonte F. Analysis of glutathione: implication in redox and detoxification. Clin Chim Acta. 2003;333:19–39. - PubMed
-
- Yang Y, Dieter MZ, Chen Y, Shertzer HG, Nebert DW, Dalton TP. Initial characterization of the glutamate-cysteine ligase modifier subunit Gclm(−/−) knockout mouse. Novel model system for a severely compromised oxidative stress response. J Biol Chem. 2002;277:49446–49452. - PubMed
-
- McConnachie LA, Mohar I, Hudson FN, Ware CB, Ladiges WC, Fernandez C, et al. Glutamate cysteine ligase modifier subunit deficiency and gender as determinants of acetaminophen-induced hepatotoxicity in mice. Toxicol Sci. 2007;99:628–636. - PubMed
Publication types
MeSH terms
Substances
LinkOut - more resources
Full Text Sources
Other Literature Sources
Molecular Biology Databases
Research Materials
Miscellaneous

