. 2013 Oct;20(10):1293-305.
doi: 10.1038/cdd.2013.69. Epub 2013 Jun 21.

Blebs produced by actin-myosin contraction during apoptosis release damage-associated molecular pattern proteins before secondary necrosis occurs

Affiliations

Blebs produced by actin-myosin contraction during apoptosis release damage-associated molecular pattern proteins before secondary necrosis occurs

G R Wickman et al. Cell Death Differ. 2013 Oct.

Abstract

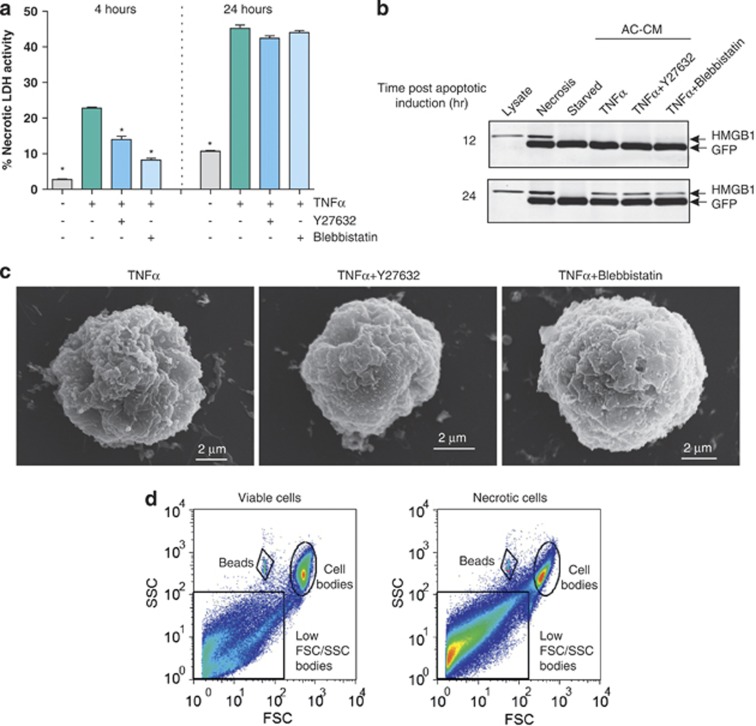
Apoptosis is a fundamental homeostatic mechanism essential for the normal growth, development and maintenance of every tissue and organ. Dying cells have been defined as apoptotic by distinguishing features, including cell contraction, nuclear fragmentation, blebbing, apoptotic body formation and maintenance of intact cellular membranes to prevent massive protein release and consequent inflammation. We now show that during early apoptosis limited membrane permeabilization occurs in blebs and apoptotic bodies, which allows release of proteins that may affect the proximal microenvironment before the catastrophic loss of membrane integrity during secondary necrosis. Blebbing, apoptotic body formation and protein release during early apoptosis are dependent on ROCK and myosin ATPase activity to drive actomyosin contraction. We identified 231 proteins released from actomyosin contraction-dependent blebs and apoptotic bodies by adapted SILAC (stable isotope labeling with amino acids in cell culture) combined with mass spectrometry analysis. The most enriched proteins released were the nucleosomal histones, which have previously been identified as damage-associated molecular pattern proteins (DAMPs) that can initiate sterile inflammatory responses. These results indicate that limited membrane permeabilization occurs in blebs and apoptotic bodies before secondary necrosis, leading to acute and localized release of immunomodulatory proteins during the early phase of active apoptotic membrane blebbing. Therefore, the shift from apoptosis to secondary necrosis is more graded than a simple binary switch, with the membrane permeabilization of apoptotic bodies and consequent limited release of DAMPs contributing to the transition between these states.


Figures

Figure 1
Figure 1
Blebs and apoptotic bodies allow pre-necrotic entry of PI. (a) Live confocal image of apoptotic NIH3T3 stained with fluorescent lipid stain DiO (green) and PI (red). (b) Time series of apoptotic NIH3T3 reveals PI (red)-positive apoptotic bodies. White, blue, yellow and red arrows track individual apoptotic bodies. Time index is hr:min:sec following apoptosis induction with TNFα/CHX
Figure 2
Figure 2
Actomyosin-dependent apoptotic bodies permit macromolecule ingress. (a) Representative FACS scatter plots of FSC and SSC of apoptotic NIH3T3 cells at 4 h gated for apoptotic bodies (left) and without or with PI staining plotted versus FSC with TNFα/CHX alone or with RNAseA or RNAseA+DNAse1 as indicated. (b) Histogram indicates mean number±S.E.M. (*P<0.01, Student's t-test, n=3–5) of PI-positive apoptotic bodies for each paired condition in NIH3T3 established mouse fibroblasts. (c) Histogram indicates mean number±S.E.M. (*P<0.01, Student's t-test, n=3–5) of PI-positive apoptotic bodies for each paired condition in primary MEFs. (d) Histogram indicates mean number±S.E.M. (*P<0.01, Student's t-test, n=3–5) of PI-positive apoptotic bodies for each paired condition in MCF10a human mammary epithelial cells. (e) Histogram indicates mean number±S.E.M. (*P<0.01, Student's t-test, n=3–5) of PI-positive apoptotic bodies for each paired condition in primary mouse keratinocytes. (f) Representative FACS histogram plots of fluorescence in NIH3T3 parental cells (no fill) or cells transduced with membrane-targeted GFP (green fill; left panel) and their apoptotic bodies at 4 h after apoptosis induction (right panel). Cutoff indicates apoptotic body GFP fluorescence greater than autofluorescence. (g) Histogram indicates means±S.E.M. (*P<0.01, Student's t-test, n=3) of percentage GFP-positive apoptotic bodies without or with Proteinase K treatment as indicated. (h) Representative FACS scatter plots of GFP and SSC of unlabeled apoptotic NIH3T3 or cells transduced with membrane-targeted GFP at 4 h gated for GFP-positive apoptotic bodies (upper panels) and without or with PI staining plotted versus GFP (lower panels) as indicated. (i) Histogram indicates means±S.E.M. (*P<0.01, Student's t-test, n=8) of double GFP/PI-positive apoptotic bodies in the absence or presence of RNAseA+DNAse1 as indicated
Figure 3
Figure 3
Actomyosin-dependent apoptotic bodies permit protein release. (a) Scanning electron micrographs of representative apoptotic NIH3T3 cells treated with TNFα/CHX alone, with Y27632 or with Blebbistatin for 4 h as indicated. (b) Representative FSC and SSC FACS scatter plots of untreated cells or 4-h apoptotic NIH3T3 cell apoptotic bodies and added 10 000 FITC-labeled microbeads counted in each treatment. Histogram indicates means±S.E.M. (*P<0.01, Student's t-test, n=4) of small FSC/SSC body numbers generated. (c) Representative FSC and SSC FACS scatter plot of 4-h apoptotic NIH3T3 cell apoptotic bodies and added 10 000 FITC-labeled microbeads counted in each treatment. Histogram indicates means±S.E.M. (*P<0.01, ANOVA followed by Dunnett's multiple comparison test, n=4–5) of apoptotic body numbers generated with indicated treatments. (d) Caspase 3/7 activity for each treatment relative to basal level (n=3). Inset shows western of ROCK1 cleavage time course in response to TNFα/CHX±Y27632. (e) ROCK1 knockdown reduced apoptotic body number. Histogram indicates means±S.E.M. (*P<0.01, Student's t-test, n=5) of small FSC/SSC body numbers generated in NTC or ROCK1 siRNA transfected conditions. Western blots show ROCK1, caspase-cleaved PARP1 or ERK2 in NTC or ROCK1 siRNA transfected cells as indicated. (f) ROCK1 knockdown inhibits apoptotic membrane blebbing. Representative scanning electron micrographs of NTC (left panel) or ROCK1 (right panel) siRNA transfected cells
Figure 4
Figure 4
Late secondary necrotic cells release LDH and HMGB1. (a) LDH activity in NIH3T3 AC-CM. Histogram indicates means±S.E.M. (*P<0.001, ANOVA followed by Dunnett's multiple comparison test versus TNFα alone at each time point, n=3). Conditioned media were concentrated and normalized to recombinant GFP that had been added before concentration as a processing control. Sample activity is normalized as percentage LDH activity in freeze-thaw necrotic sample at each time point. (b) Western blot of HMGB1 in NIH3T3 whole-cell lysate, freeze-thaw necrotic lysate or concentrated conditioned medium from starved cells or apoptotic cells (AC-CM) with Y27632 or Blebbistatin as indicated at 12 or 24 h. Recombinant GFP was added to samples before the concentration to control for processing. (c) Scanning electron micrographs of representative necrotic NIH3T3 cells treated with TNFα/CHX alone with Y27632 or with Blebbistatin for 24 h as indicated. (d) Representative FSC and SSC FACS scatter plots of viable healthy cells and 24-h necrotic NIH3T3 cells with low FSC/SSC bodies and added 10 000 FITC-labeled microbeads counted in each treatment. Indicated position of cell bodies was determined for viable cells and transposed to necrotic cell plot
Figure 5
Figure 5
Proteins released from actomyosin-dependent blebs and apoptotic bodies. (a) Coomassie-stained polyacrylamide gel of concentrated proteins in AC-CM from equal cells numbers for indicated treatments. (b) Log-plot of fold change in individual protein release (apoptotic/control) in AC-CM. (c) Log-plot of fold change in individual protein release (apoptotic/control) in AC-CM compared with log-plot of each proteins molecular weight (kDa). (d) Classification of released protein functions as determined by GeneGo gene ontology analysis. (e) Coomassie stained polyacrylamide gel of proteins in collected apoptotic bodies (left panel) and western blots of Lamin A (middle panel) and Gelsolin (right panel). (f) Representative western blot of AC-CM at 4 h probed for Gelsolin. Conditioned media were concentrated and normalized to recombinant GFP that has been added to the samples before concentration as a processing control. Histogram indicates means±S.E.M. of Gelsolin release relative to TNFα/CHX alone at each time (*P<0.01, ANOVA followed by Dunnett's multiple comparison test versus TNFα/CHX alone, n=3)
Figure 6
Figure 6
Apoptotic cells release proteins that interact with macrophages. (a) Transmission electron micrograph of an apoptotic TNFα/CHX-treated NIH3T3 cell, arrow indicates portion of nucleus within a bleb. (b) Fluorescence micrograph of apoptotic TNFα/CHX-treated NIH3T3 cells-expressing GFP-histone H3, stained for DNA with DAPI and filamentous actin with Texas red-conjugated Phalloidin. (c) Representative FSC and SSC FACS scatter plot of 4-h TNFα/CHX-treated NIH3T3 apoptotic bodies (left panel). GFP-H3-positive apoptotic bodies were identified by fluorescence greater than autofluorescence evident in control non-expressing cells (second left and middle panels). The proportions of gated GFP-positive apoptotic bodies in 10 000 counted events are shown, for example, TNFα/CHX control (middle), TNFα/CHX plus Y27632 (second right panel) and TNFα/CHX plus Blebbistatin (right panel) treatments. (d) Histogram indicates mean number±S.E.M. (*P<0.01, ANOVA followed by Dunnett's multiple comparison test versus TNFα/CHX alone, n=4) of GFP-H3-positive apoptotic bodies generated with indicated treatments. (e) Histogram indicates mean percentage±S.E.M. (*P<0.01, ANOVA followed by Dunnett's multiple comparison test versus TNFα/CHX alone, n=4) of GFP-H3-positive apoptotic bodies generated with indicated treatments
Figure 7
Figure 7
Histones are phagocytosed and activate macrophages. (a) Mass/charge plot showing relative abundance of unlabeled (Lys0) endogenous and AC-CM Lys8-labeled histone H2B peptide in RAW-264.7 cell lysates. Peaks for Lys8-labeled peptide within the indicated box have been expanded 10-fold for visibility. (b) Histogram indicates mean±S.E.M. (*P<0.01, ANOVA followed by Dunnett's multiple comparison test versus TNFα/CHX alone, n=3) of TNFα release (pg/ml) with indicated histone treatments (μg/ml). (c) Increased NFKBIA phosphorylation induced by H2A protein. Representative western blotting of phosphorylated and total NFKBIA in control and H2A treated conditions. Histogram indicates mean±S.E.M. (*P<0.05, one-tailed Student's t-test, n=3) relative phosphorylated NFKBIA (pNFKBIA) to total NFKBIA ratio, normalized to an average control value=1. (d) Apoptotic blebs and bodies are indicated in gray and red. Red indicates membrane permeabilization and protein release. Some proteins released may interact with and be ingested by macrophages to help activate non-infectious inflammatory responses before the complete loss of membrane integrity that may occur during secondary necrosis

References

    1. Elliott MR, Ravichandran KS. Clearance of apoptotic cells: implications in health and disease. J Cell Biol. 2010;189:1059–1070. - PMC - PubMed
    1. Erwig L-P, Henson PM. Immunological consequences of apoptotic cell phagocytosis. Am J Path. 2007;171:2–8. - PMC - PubMed
    1. Wickman G, Julian L, Olson MF. How apoptotic cells aid in the removal of their own cold dead bodies. Cell Death Differ. 2012;19:735–742. - PMC - PubMed
    1. Savill J, Fadok V. Corpse clearance defines the meaning of cell death. Nature. 2000;407:784–788. - PubMed
    1. Kono H, Rock KL. How dying cells alert the immune system to danger. Nat Rev Immunol. 2008;8:279–289. - PMC - PubMed