. 2013 Jul 21;58(14):4749-61.
doi: 10.1088/0031-9155/58/14/4749. Epub 2013 Jun 20.

Combined ultrasound and MR imaging to guide focused ultrasound therapies in the brain

Affiliations

Combined ultrasound and MR imaging to guide focused ultrasound therapies in the brain

Costas D Arvanitis et al. Phys Med Biol. .

Abstract

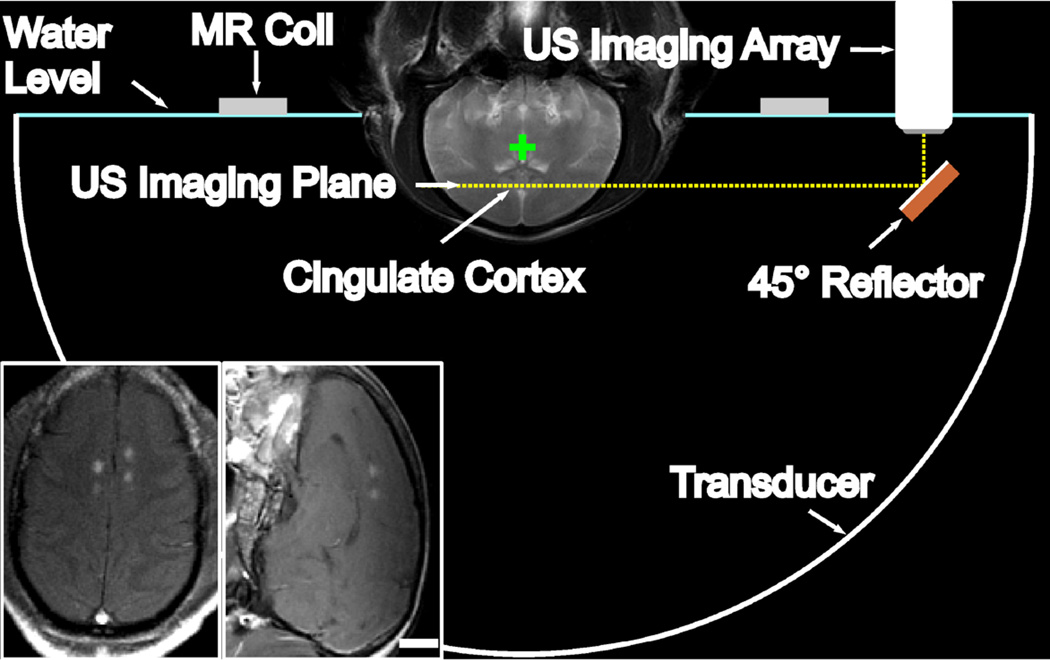
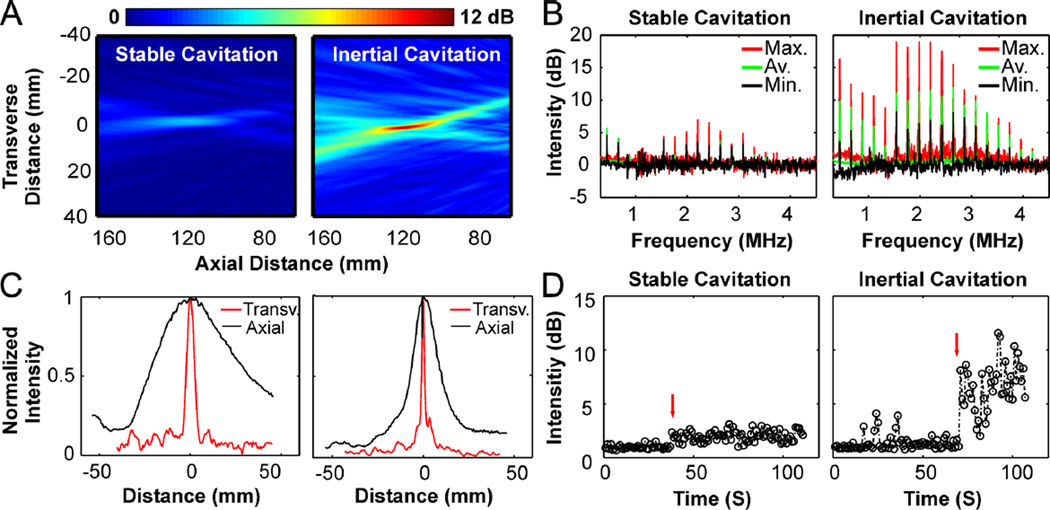
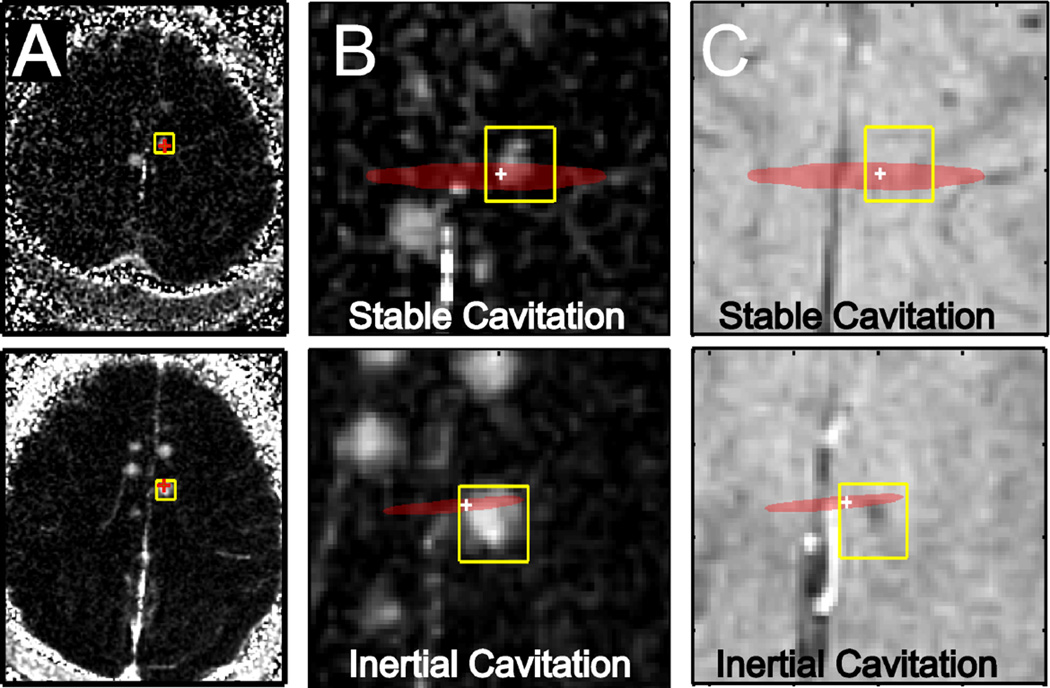
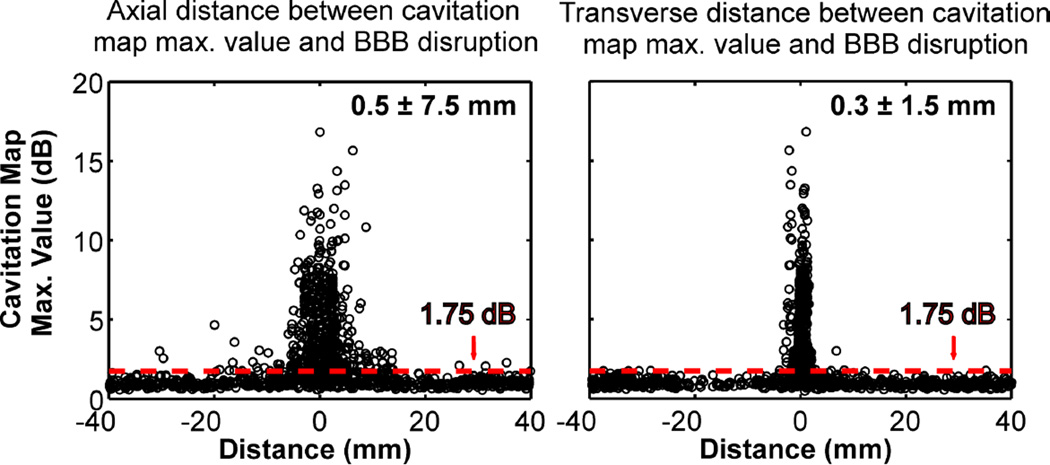
Several emerging therapies with potential for use in the brain, harness effects produced by acoustic cavitation--the interaction between ultrasound and microbubbles either generated during sonication or introduced into the vasculature. Systems developed for transcranial MRI-guided focused ultrasound (MRgFUS) thermal ablation can enable their clinical translation, but methods for real-time monitoring and control are currently lacking. Acoustic emissions produced during sonication can provide information about the location, strength and type of the microbubble oscillations within the ultrasound field, and they can be mapped in real-time using passive imaging approaches. Here, we tested whether such mapping can be achieved transcranially within a clinical brain MRgFUS system. We integrated an ultrasound imaging array into the hemisphere transducer of the MRgFUS device. Passive cavitation maps were obtained during sonications combined with a circulating microbubble agent at 20 targets in the cingulate cortex in three macaques. The maps were compared with MRI-evident tissue effects. The system successfully mapped microbubble activity during both stable and inertial cavitation, which was correlated with MRI-evident transient blood-brain barrier disruption and vascular damage, respectively. The location of this activity was coincident with the resulting tissue changes within the expected resolution limits of the system. While preliminary, these data clearly demonstrate, for the first time, that it is possible to construct maps of stable and inertial cavitation transcranially, in a large animal model, and under clinically relevant conditions. Further, these results suggest that this hybrid ultrasound/MRI approach can provide comprehensive guidance for targeted drug delivery via blood-brain barrier disruption and other emerging ultrasound treatments, facilitating their clinical translation. We anticipate that it will also prove to be an important research tool that will further the development of a broad range of microbubble-enhanced therapies.


Figures

Fig 1
Fig 1
Pre- and post-sonication MRI of a macaque within the MRgFUS device in the presence of the ultrasound imaging system. A coronal T2-weighted MR image used for treatment planning is shown (pre-sonication). It has been annotated to show the location of the 30 cm diameter hemisphere MRgFUS transducer, the ultrasound imaging array that was connected to the research imaging engine, and the MRI surface coil. The annotations were drawn to scale with the location of the head in a typical position. A 45° brass reflector was used to create an axial imaging plane (yellow dotted line). The imaging array was located 13 cm away from FUS geometrical focus, similar to what might be used in a human. Additional acoustic emissions measurements were obtained using two piezoelectric elements placed in front and back of the head (not shown) at the depth of the geometric focus of the FUS transducer (green cross). The focal point was moved to different brain targets without moving the transducer using the phased array for electronic beam steering. Inset (post sonication): Axial (left image) and sagittal (right image) contrast-enhanced T1-weighted MR images showing discrete spots with contrast enhancement, reflecting the localized BBB disruption induced by the sonications. The half-intensity beam width of the focal region for this MRgFUS system was 3.0 and 5.8 mm in the lateral and axial directions respectively. Bar: 1 cm.
Fig 2
Fig 2
Representative data obtained transcranially from two different animals with the passive US imaging system during sonications in the cingulate cortex. (A) Average cavitation maps of all of the bursts applied during the highest power sonication applied at two targets in one monkey. The images were normalized to data obtained during sonications with identical settings without microbubbles. They are scaled equally and are expressed in dB. The ultrasound imaging array was located to the right of the images (B) The corresponding normalized power spectra (NPS) for these sonications are shown for the bursts with the weakest and strongest signals as well as the average over all bursts. From this analysis, we can conclude that the left image in (A) was formed by acoustic emissions with harmonic components only (i.e. stable cavitation), and the right image in (A) was formed by acoustic emissions with harmonic, ultra-harmonic and broadband components (i.e. inertial cavitation). The frequency axis was normalized to the sonication frequency (0.22 MHz). (C) The respective axial and transverse profiles of the maps (right-left and anterior-posterior in transverse and coronal plane respectively in MR coordinates). The FWHM of the activity with stable cavitation was 5 and 55 mm in the transverse and axial directions, respectively. With inertial cavitation, these values were 1.74 and 17 mm. (D) The maximum value of the cavitation map as a function of time for stable (left) and inertial (right) cavitation activity. Sonication, imaging, and microbubble injection began simultaneously; the arrow marks the arrival to the microbubbles to the focal region. The spikes prior to this time are presumably from microbubbles remaining in the circulation from a previous sonication.
Fig 3
Fig 3
Fusion of averaged stable and inertial passive cavitation maps from the two sonications shown in Fig. 2 (A) Images showing signal enhancement in T1-weighted MRI after Gd-DTPA injection. Top: Data from the sonication with stable cavitation. Bottom: Data from the sonication with inertial cavitation. (B) A region showing the pixels in the cavitation maps within 95% of the maximum value is shown; it overlapped with the contrast enhancement. The pixel with the maximum cavitation activity is noted with a “+”. The enhancement from other targets sonicated in the same session is visible. (C) T2*-weighted images, which become hypointense at the focal spot when petechiae are induced by inertial cavitation. A small hypointense spot was observed (arrow) after the sonication with broadband emission, a signature for inertial cavitation. The ultrasound imaging array was located to the right of the images.
Fig 4
Fig 4
Evaluation of the colocalization of the cavitation activity and the resulting BBB disruption. Plot of the strength of the cavitation maps at the pixel with the greatest activity as a function of the distance between this pixel and the center of MRI contrast enhancement (left: distance in the axial direction in the ultrasound images; right: transverse direction). Data are shown from the individual cavitation maps obtained for each burst for all of the targets examined (N=1475). When the cavitation activity was greater than 1.75 dB the localization was reliable. The median distance between the maximum cavitation activity and the location of the BBB disruption was within the range of theoretical estimates for the resolution of the cavitation maps (7.5 and 0.5 mm in the axial and transverse directions, respectively).

References

    1. Arvanitis CD, McDannold N. Simultaneous temperature and cavitation activity mapping with a transcranial MR-guided focused ultrasound system. Proc. IEEE International Ultrasonics Sumposium. 2011:128–131.
    1. Arvanitis CD, Vykhodtseva N, Livingstone MS, McDannold N. Controlled Ultrasound-Induced Blood-Brain Barrier Disruption Using Passive Acoustic Emissions Monitoring. PLoS ONE. 2012;24:9. - PMC - PubMed
    1. Bazan-Peregrino M, Arvanitis CD, Rifai B, Seymour LW, Coussios CC. Ultrasound-induced cavitation enhances the delivery and therapeutic efficacy of an oncolytic virus in an in vitro model. J Control Release. 2012;157:235–242. - PubMed
    1. Clement GT, Hynynen K. A non-invasive method for focusing ultrasound through the human skull. Physics in medicine and biology. 2002;47:1219–1236. - PubMed
    1. Czarnota GJ, Karshafian R, Burns PN, Wong S, Al Mahrouki A, Lee JW, Caissie A, Tran W, Kim C, Furukawa M, Wong E, Giles A. Tumor radiation response enhancement by acoustical stimulation of the vasculature. Proceedings of the National Academy of Sciences of the United States of America. 2012;109:E2033–E2041. - PMC - PubMed

Publication types