. 2013 Aug;83(8):728-38.
doi: 10.1002/cyto.a.22319. Epub 2013 Jun 20.

A harmonized approach to intracellular cytokine staining gating: Results from an international multiconsortia proficiency panel conducted by the Cancer Immunotherapy Consortium (CIC/CRI)

Affiliations

A harmonized approach to intracellular cytokine staining gating: Results from an international multiconsortia proficiency panel conducted by the Cancer Immunotherapy Consortium (CIC/CRI)

Lisa K McNeil et al. Cytometry A. 2013 Aug.

Abstract

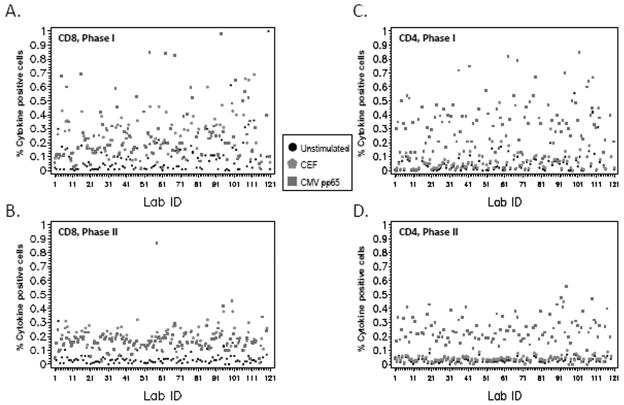
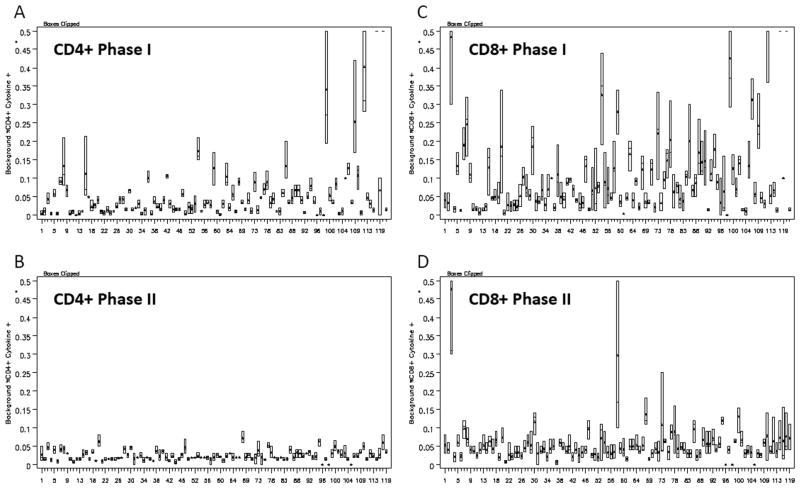
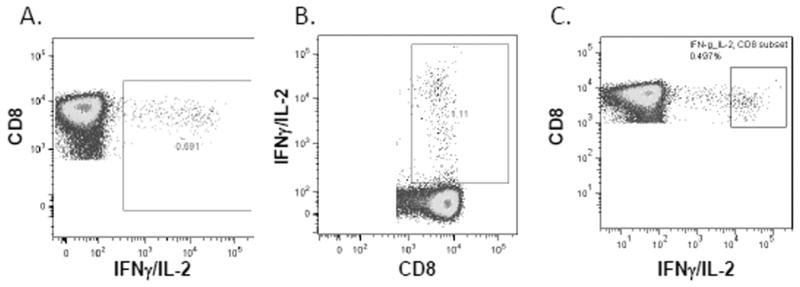
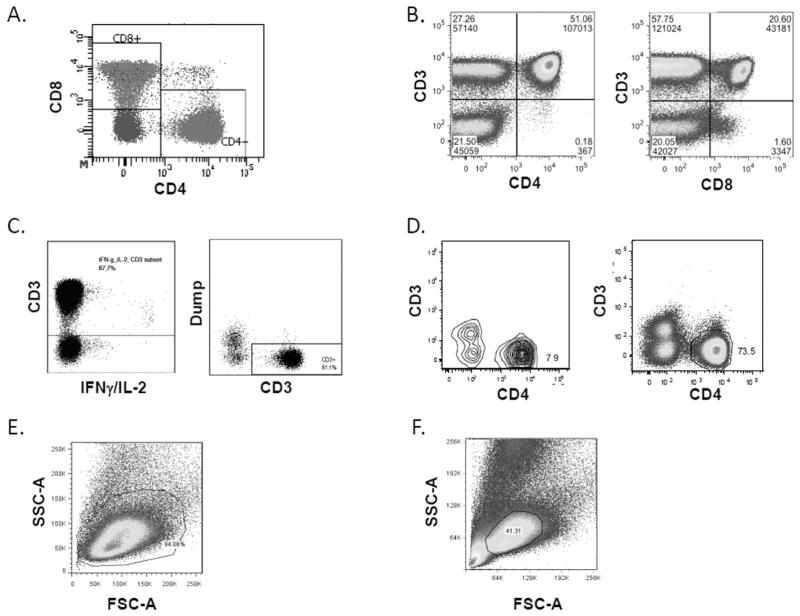
Previous results from two proficiency panels of intracellular cytokine staining (ICS) from the Cancer Immunotherapy Consortium and panels from the National Institute of Allergy and Infectious Disease and the Association for Cancer Immunotherapy highlight the variability across laboratories in reported % CD8+ or % CD4+ cytokine-positive cells. One of the main causes of interassay variability in flow cytometry-based assays is due to differences in gating strategies between laboratories, which may prohibit the generation of robust results within single centers and across institutions. To study how gating strategies affect the variation in reported results, a gating panel was organized where all participants analyzed the same set of Flow Cytometry Standard (FCS) files from a four-color ICS assay using their own gating protocol (Phase I) and a gating protocol drafted by consensus from the organizers of the panel (Phase II). Focusing on analysis removed donor, assay, and instrument variation, enabling us to quantify the variability caused by gating alone. One hundred ten participating laboratories applied 110 different gating approaches. This led to high variability in the reported percentage of cytokine-positive cells and consequently in response detection in Phase I. However, variability was dramatically reduced when all laboratories used the same gating strategy (Phase II). Proximity of the cytokine gate to the negative population most impacted true-positive and false-positive response detection. Recommendations are provided for the (1) placement of the cytokine-positive gate, (2) identification of CD4+ CD8+ double-positive T cells, (3) placement of lymphocyte gate, (4) inclusion of dim cells, (5) gate uniformity, and 6) proper adjustment of the biexponential scaling.

Keywords: ICS; assay harmonization; gating; immune monitoring; proficiency panel.


Figures

Figure 1
Figure 1
Decreased variability if same gating strategy is used. Graph describes the percentage of cytokine-positive CD8+ (A and B) and CD4+ T cells (C and D) for Donor 1 with each of the three stimulants (unstimulated, CEF, and CMV) for all 110 participating laboratories. Unstimulated results are indicated by a black dot, CEF results are indicated by a red pentagon, and CMV results are indicated by a green square. The results from (A and C) Phase I using laboratory-specific gating protocol and (B and D) Phase II using consensus gating protocol are shown. [Color figure can be viewed in the online issue, which is available at wileyonlinelibrary.com.]
Figure 2
Figure 2
Background is decreased when laboratories use the consensus gating strategy. Box plot of (A) CD4+ background cytokine-positive levels (all three cytokine-positive percentages reported for the unstimulated samples of the three donors for each laboratory in Phase I, (B) all CD4+ background cytokine-positive levels for each laboratory in Phase II, (C) all CD8+ background cytokine-positive levels for each laboratory in Phase I, and (D) of all CD8+ background cytokine-positive levels for each laboratory in Phase II.
Figure 3
Figure 3
Different approaches to the placement of cytokine-positive gate. Actual graphs from different participating laboratories, all of the examples are from the same FCS file, Donor 2, CEF stimulated. (A) An example of a cytokine gate with adequate proximity. (B) A cytokine gate that is too close to the negative population. (C) A cytokine gate that is drawn too far from the negative population, missing many cytokine-positive cells. [Color figure can be viewed in the online issue, which is available at wileyonlinelibrary.com.]
Figure 4
Figure 4
DP T cell gate, dim gates, and lymphocyte gate. Actual graphs from different participating laboratories, all of the examples are from the same FCS file, Donor 2, CEF stimulated. (A) CD4 and CD8 are gated in the same dot plot, making it very easy to identify the DP cells. (B) CD4 and CD8 are gated versus CD3. The DP cell population is not differentiated and thus is included with both CD4 and CD8 gates. (C) CD3 dim or low-positive cells are included in the CD3 gate. (D) CD3 gate is drawn too tightly and the dim cells are not included in the gate. (E) Lymphocyte gate is large enough to include all lymphocytes. (F) Lymphocyte gate is too narrow and excludes many lymphocytes. [Color figure can be viewed in the online issue, which is available at wileyonlinelibrary.com.]
Figure 5
Figure 5
Uniform gates and biexponential scaling. Actual graphs from different participating laboratories, all of the examples are from the same FCS file, Donor 2, CEF stimulated. (A) The cytokine gate for Donor 2 is displayed with unstimulated on the left and CEF stimulated on the right. The cytokine gates are not uniform and are much larger in the CEF-stimulated sample. (B) Three dot plots are shown with incorrectly applied biexponential scaling. The dot plot on the left has a trimodal CD4 population, the middle dot plot has a trimodal CD8 population, and the dot plot on the right displays under-scaled populations, where some of the cells are pushed against the axis. [Color figure can be viewed in the online issue, which is available at wileyonlinelibrary.com.]

References

    1. Cebon J, Knights A, Ebert L, Jackson H, Chen W. Evaluation of cellular immune responses in cancer vaccine recipients: Lessons from NY-ESO-1. Expert Rev Vaccines. 2010;9:617–629. - PubMed
    1. Nagorsen D, Scheibenbogen C, Thiel E, Keilholz U. Immunological monitoring of cancer vaccine therapy. Expert Opin Biol Ther. 2004;4:1677–1684. - PubMed
    1. van der Burg SH, Kalos M, Gouttefangeas C, Janetzki S, Ottensmeier C, Welters MJ, Romero P, Britten CM, Hoos A. Harmonization of immune biomarker assays for clinical studies. Sci Transl Med. 2011;3:108ps44. - PubMed
    1. Maecker HT, Rinfret A, D’Souza P, Darden J, Roig E, Landry C, Hayes P, Birungi J, Anzala O, Garcia M, et al. Standardization of cytokine flow cytometry assays. BMC Immunol. 2005;6:13. - PMC - PubMed
    1. Nomura L, Maino VC, Maecker HT. Standardization and optimization of multiparameter intracellular cytokine staining. Cytometry Part A. 2008;73A:984–991. - PubMed

Publication types

LinkOut - more resources