

Comparative analysis of mammalian Y chromosomes illuminates ancestral structure and lineage-specific evolution
- PMID: 23788650
- PMCID: PMC3759724
- DOI: 10.1101/gr.154286.112
Comparative analysis of mammalian Y chromosomes illuminates ancestral structure and lineage-specific evolution
Abstract
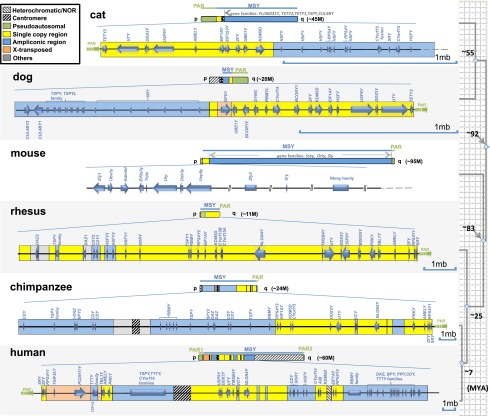
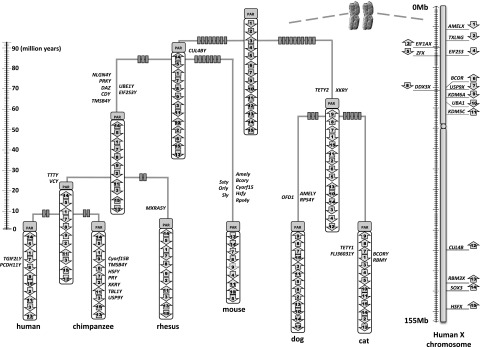
Although more than thirty mammalian genomes have been sequenced to draft quality, very few of these include the Y chromosome. This has limited our understanding of the evolutionary dynamics of gene persistence and loss, our ability to identify conserved regulatory elements, as well our knowledge of the extent to which different types of selection act to maintain genes within this unique genomic environment. Here, we present the first MSY (male-specific region of the Y chromosome) sequences from two carnivores, the domestic dog and cat. By combining these with other available MSY data, our multiordinal comparison allows for the first accounting of levels of selection constraining the evolution of eutherian Y chromosomes. Despite gene gain and loss across the phylogeny, we show the eutherian ancestor retained a core set of 17 MSY genes, most being constrained by negative selection for nearly 100 million years. The X-degenerate and ampliconic gene classes are partitioned into distinct chromosomal domains in most mammals, but were radically restructured on the human lineage. We identified multiple conserved noncoding elements that potentially regulate eutherian MSY genes. The acquisition of novel ampliconic gene families was accompanied by signatures of positive selection and has differentially impacted the degeneration and expansion of MSY gene repertoires in different species.
Figures
Similar articles
-
The Y chromosomes of the great apes.Hum Genet. 2017 May;136(5):511-528. doi: 10.1007/s00439-017-1769-8. Epub 2017 Mar 6. Hum Genet. 2017. PMID: 28265767 Review.
-
A gene catalogue of the euchromatic male-specific region of the horse Y chromosome: comparison with human and other mammals.PLoS One. 2011;6(7):e21374. doi: 10.1371/journal.pone.0021374. Epub 2011 Jul 25. PLoS One. 2011. PMID: 21799735 Free PMC article.
-
Gene discovery and comparative analysis of X-degenerate genes from the domestic cat Y chromosome.Genomics. 2008 Nov;92(5):329-38. doi: 10.1016/j.ygeno.2008.06.012. Epub 2008 Aug 28. Genomics. 2008. PMID: 18674610
-
The pig X and Y Chromosomes: structure, sequence, and evolution.Genome Res. 2016 Jan;26(1):130-9. doi: 10.1101/gr.188839.114. Epub 2015 Nov 11. Genome Res. 2016. PMID: 26560630 Free PMC article.
-
Origins of primate chromosomes - as delineated by Zoo-FISH and alignments of human and mouse draft genome sequences.Cytogenet Genome Res. 2005;108(1-3):122-38. doi: 10.1159/000080810. Cytogenet Genome Res. 2005. PMID: 15545724 Review.
Cited by
-
Expression and epigenomic landscape of the sex chromosomes in mouse post-meiotic male germ cells.Epigenetics Chromatin. 2016 Oct 27;9:47. doi: 10.1186/s13072-016-0099-8. eCollection 2016. Epigenetics Chromatin. 2016. PMID: 27795737 Free PMC article.
-
The ninth life of the cat reference genome, Felis_catus.PLoS Genet. 2020 Oct 22;16(10):e1009045. doi: 10.1371/journal.pgen.1009045. eCollection 2020 Oct. PLoS Genet. 2020. PMID: 33091014 Free PMC article. No abstract available.
-
The evolutionary history of grey wolf Y chromosomes.Mol Ecol. 2019 May;28(9):2173-2191. doi: 10.1111/mec.15054. Epub 2019 Apr 10. Mol Ecol. 2019. PMID: 30788868 Free PMC article.
-
A gene deriving from the ancestral sex chromosomes was lost from the X and retained on the Y chromosome in eutherian mammals.BMC Biol. 2022 Jun 9;20(1):133. doi: 10.1186/s12915-022-01338-8. BMC Biol. 2022. PMID: 35676717 Free PMC article.
-
The Y chromosomes of the great apes.Hum Genet. 2017 May;136(5):511-528. doi: 10.1007/s00439-017-1769-8. Epub 2017 Mar 6. Hum Genet. 2017. PMID: 28265767 Review.
References
-
- Bachtrog D 2004. Evidence that positive selection drives Y-chromosome degeneration in Drosophila miranda. Nat Genet 36: 518–522 - PubMed
Publication types
MeSH terms
LinkOut - more resources
Full Text Sources
Other Literature Sources
Miscellaneous