. 2013 Aug;33(8):1902-10.
doi: 10.1161/ATVBAHA.113.301579. Epub 2013 Jun 20.

Lysine acetyltransferase PCAF is a key regulator of arteriogenesis

Affiliations

Lysine acetyltransferase PCAF is a key regulator of arteriogenesis

Antonius J N M Bastiaansen et al. Arterioscler Thromb Vasc Biol. 2013 Aug.

Abstract

Objective: Therapeutic arteriogenesis, that is, expansive remodeling of preexisting collaterals, using single-action factor therapies has not been as successful as anticipated. Modulation of factors that act as a master switch for relevant gene programs may prove more effective. Transcriptional coactivator p300-CBP-associated factor (PCAF) has histone acetylating activity and promotes transcription of multiple inflammatory genes. Because arteriogenesis is an inflammation-driven process, we hypothesized that PCAF acts as multifactorial regulator of arteriogenesis.

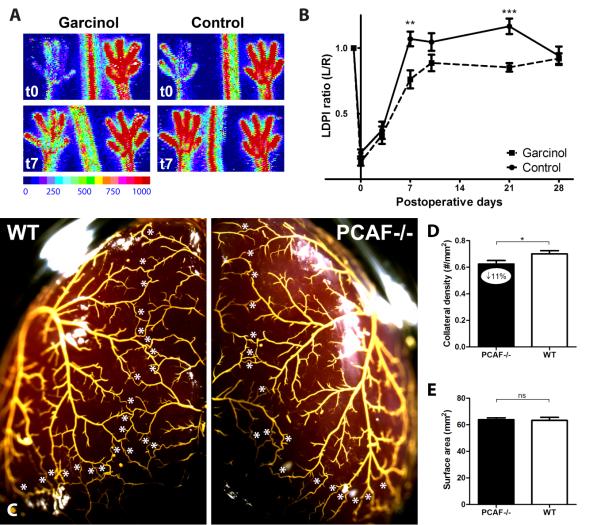
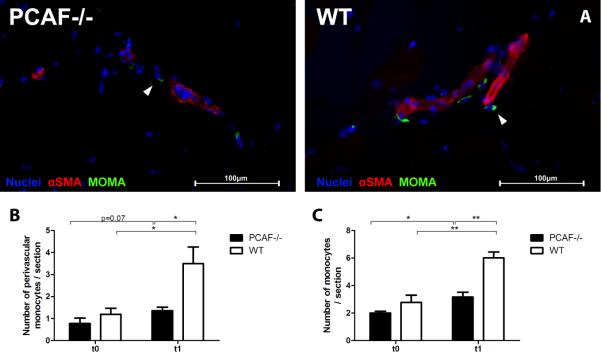
Approach and results: After induction of hindlimb ischemia, blood flow recovery was impaired in both PCAF(-/-) mice and healthy wild-type mice treated with the pharmacological PCAF inhibitor Garcinol, demonstrating an important role for PCAF in arteriogenesis. PCAF deficiency reduced the in vitro inflammatory response in leukocytes and vascular cells involved in arteriogenesis. In vivo gene expression profiling revealed that PCAF deficiency results in differential expression of 3505 genes during arteriogenesis and, more specifically, in impaired induction of multiple proinflammatory genes. Additionally, recruitment from the bone marrow of inflammatory cells, in particular proinflammatory Ly6C(hi) monocytes, was severely impaired in PCAF(-/-) mice.

Conclusions: These findings indicate that PCAF acts as master switch in the inflammatory processes required for effective arteriogenesis.

Keywords: inflammation; monocytes; p300-CBP–associated factor; peripheral arterial disease.


Figures

Figure 1
Figure 1
Arteriogenesis in PCAF−/− mice. (A) Representative LDPI images (laser Doppler perfusion imaging) of paws from PCAF−/− and WT mice directly and 7 days after induction of HLI in the left limb, by double electrocoagulation of the femoral artery. High blood flow is displayed in red. (B) Quantification of LDPI measurements of PCAF−/− and WT mice over time. Data are calculated as the ratio of ligated over non-ligated paw. (C) Quantification of LDPI measurements of PCAF−/− and WT mice directly after induction of HLI. Data are calculated as the ratio of ligated over non-ligated paw. (D) Quantification of necrotic toe nails of the ligated limb in PCAF−/− and WT mice counted 28 days after HLI. (E). Immunohistochemical staining of paraffin-embedded adductor muscle group of PCAF−/− and WT mice 28 days after HLI using anti-αSMA (red) antibodies. Lumen diameter of αSMA+ vessels is indicated by black bars. Scale bars = 50 μm. (F-H) Number, mean lumen area (μm2) and total lumen area per section (μm2 / section) of αSMA+ vessels, measured at the center of the adductor muscle group in ligated and non-ligated limbs of PCAF−/− and WT mice. Data are calculated as the ratio of ligated over non-ligated paw. All values are presented as the mean ± SEM. *P < 0.05, **P < 0.01, ***P < 0.001.
Figure 2
Figure 2
Arteriogenesis after pharmacological inhibition of PCAF and assessment of the pre-existing collateral bed in PCAF−/− mice. (A) Representative LDPI images of paws directly and 7 days after induction of HLI in the left limb, by single electrocoagulation of the femoral artery. In WT mice, pluronic gel with or without 25 mg/ml Garcinol was applied topically to the adductor muscle before skin closure. High blood flow is displayed in red. (B) Quantification of LDPI measurements of WT mice treated with Garcinol or control over time. (C) Representative images of the pial circulation in PCAF−/− and WT mice. White asterisks indicate collateral arteries between anterior, middle and posterior cerebral arteries (ACA, MCA and PCA, respectively). Following exsanguination and maximal dilation of the dorsal cerebral circulation, Microfil™ was used as a casting agent, after which the whole brain was fixated in 4% PFA. (D) Pial collateral density was calculated in PCAF−/− and WT mice by dividing the sum of ACA to MCA, ACA to PCA and MCA to PCA by the surface area of the cerebral hemispheres. (E) Region of the brain utilized for calculation of pial density. Areas were excluded when they were damaged, had poor filling with Microfil™, or were otherwise uncountable. NS = non-significant. All values are presented as the mean ± SEM. *P < 0.05, PCAF−/− versus WT.
Figure 3
Figure 3
The role of PCAF in in vitro inflammatory response. (A) Inflammatory response of whole blood from PCAF−/− and WT mice was evaluated. Blood from tail vein was collected, diluted (1:25) and incubated 24 h with LPS (0-500 ng/ml). TNFα (pg/ml) level in cell-free supernatant was measured by ELISA. ND = non-detectable. (B) Splenocytes of PCAF−/− and WT mice were cultured and incubated for 24 h with LPS (300 ng/ml) or control. Splenocytes of WT mice were also incubated with Garcinol (20 μM) in combination with LPS (300 ng/ml) or control. Cell-free supernatant MCP-1 (pg/ml) level was measured by ELISA. (C) VSMCs of PCAF−/− and WT mice were cultured and incubated for 24 h with LPS (0.1 and 1 ng/ml) or control. VSMCs of WT mice were also incubated with Garcinol (15 μM) in combination with LPS (0.1 and 1 ng/ml) or control. Cell-free supernatant MCP-1 (pg/ml) level was measured by ELISA. (D) Vascular smooth muscle cells (VSMCs) of PCAF−/− and WT mice were cultured and incubated for 24 h with LPS (1 ng/ml) or control. MCP-1 mRNA expression was measured by real-time quantitative PCR. Cts were normalized against Cts of HPRT1. All values are presented as the mean ± SEM of triplicates. *P < 0.05, **P < 0.01, ***P < 0.001.
Figure 4
Figure 4
Gene regulation in PCAF−/− mice after HLI. (A) Immunohistochemical staining on fresh frozen sections of WT adductor muscle 1 day after HLI, using anti-αSMA (red) and anti-PCAF (green) antibodies. Cell nuclei were stained with DAPI (blue). Scale bars = 50 μm. (B) Heatmap of differentially regulated genes in whole-genome expression analysis, comparing PCAF−/− and WT mice. Included are genes that were significantly different between PCAF−/− and WT mice (q-value < 5). Data are presented as the fold change in expression between day 1 (t1) and average preoperative baseline levels (t0), generating t1/t0avg ratios. Red indicates increased and green indicates reduced expression relative to average baseline levels. The pie graph illustrates a significant decrease of 1963 genes (green) and increase of 1542 (red) genes in PCAF−/− relative to WT mice. (C-G) Microarray validation by real-time quantitative PCR of a selection of relevant regulated inflammatory factors MMP9, TNFα, CCL9, IRF7, CXCL12 and its receptor CXCR4 (H). The height of the bars represents the ratio of expression in PCAF−/−(black bars) and WT (white bars) mice at day 1 over day 0. Cts were normalized against Cts of HPRT1. All values are presented as the mean ± SEM. *P < 0.05, **P < 0.01, PCAF−/− versus WT.
Figure 5
Figure 5
Monocyte recruitment in PCAF−/− mice after HLI. (A-C) Flow cytometry analysis of monocytes before (t0) and 1 day after (t1) HLI in PCAF−/− and WT mice. Values are presented as total monocyte counts in blood (nx106/mL), spleen (% of total cells) and bone marrow (% of total cells). (D-F) Flow cytometry analysis of “pro-inflammatory” Ly6Chi monocytes after HLI in PCAF−/− and WT mice. Values are presented as total Ly6Chi monocyte counts in blood (nx106/mL), spleen (% of total cells) and bone marrow (% of total cells). (G-H) Activation state of monocytes and Ly6Chi monocytes measured by mean fluorescence intensity (MFI) of CD11b. *P < 0.05, **P < 0.01, ***P < 0.001.
Figure 6
Figure 6
Monocyte recruitment to collateral arteries in PCAF−/− mice after HLI. (A) Immunohistochemical staining on fresh frozen sections of the adductor muscle group from PCAF−/− and WT mice 1 day after HLI, using anti-αSMA (red) and anti-MOMA-2 (green) antibodies. Cell nuclei were labeled with DAPI (blue). Scale bars = 100 μm. (B C) Quantification of MOMA-2 positive cells in the adductor muscle group of PCAF−/− and WT before (t0) and 1 day after (t1) HLI. Monocytes were quantified from at least six consecutive sections per mouse and expressed as the number of MOMA-2 positive cells per section and as the number of MOMA-2 positive cells in the perivascular space of αSMA+ vessels per section. *P < 0.05, **P < 0.01.

References

    1. van Oostrom MC, van Oostrom O, Quax PH, Verhaar MC, Hoefer IE. Insights into mechanisms behind arteriogenesis: what does the future hold? J Leukoc Biol. 2008;84:1379–91. - PubMed
    1. Heil M, Schaper W. Influence of mechanical, cellular, and molecular factors on collateral artery growth (arteriogenesis) Circ Res. 2004;95:449–58. - PubMed
    1. Schaper J, Konig R, Franz D, Schaper W. The endothelial surface of growing coronary collateral arteries. Intimal margination and diapedesis of monocytes. A combined SEM and TEM study. Virchows Arch A Pathol Anat Histol. 1976;370:193–205. - PubMed
    1. Bergmann CE, Hoefer IE, Meder B, Roth H, van Royen N, Breit SM, Jost MM, Aharinejad S, Hartmann S, Buschmann IR. Arteriogenesis depends on circulating monocytes and macrophage accumulation and is severely depressed in op/op mice. J Leukoc Biol. 2006;80:59–65. - PubMed
    1. Heil M, Ziegelhoeffer T, Pipp F, Kostin S, Martin S, Clauss M, Schaper W. Blood monocyte concentration is critical for enhancement of collateral artery growth. Am J Physiol Heart Circ Physiol. 2002;283:H2411–H2419. - PubMed

Publication types

MeSH terms

LinkOut - more resources