Limited contemporary gene flow and high self-replenishment drives peripheral isolation in an endemic coral reef fish
- PMID: 23789075
- PMCID: PMC3686199
- DOI: 10.1002/ece3.584
Limited contemporary gene flow and high self-replenishment drives peripheral isolation in an endemic coral reef fish
Abstract
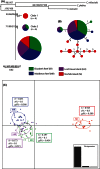
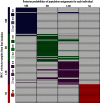
Extensive ongoing degradation of coral reef habitats worldwide has lead to declines in abundance of coral reef fishes and local extinction of some species. Those most vulnerable are ecological specialists and endemic species. Determining connectivity between locations is vital to understanding recovery and long-term persistence of these species following local extinction. This study explored population connectivity in the ecologically-specialized endemic three-striped butterflyfish (Chaetodon tricinctus) using mt and msatDNA (nuclear microsatellites) to distinguish evolutionary versus contemporary gene flow, estimate self-replenishment and measure genetic diversity among locations at the remote Australian offshore coral reefs of Middleton Reef (MR), Elizabeth Reef (ER), Lord Howe Island (LHI), and Norfolk Island (NI). Mt and msatDNA suggested genetic differentiation of the most peripheral location (NI) from the remaining three locations (MR, ER, LHI). Despite high levels of mtDNA gene flow, there is limited msatDNA gene flow with evidence of high levels of self-replenishment (≥76%) at all four locations. Taken together, this suggests prolonged population recovery times following population declines. The peripheral population (NI) is most vulnerable to local extinction due to its relative isolation, extreme levels of self-replenishment (95%), and low contemporary abundance.
Keywords: Chaetodon; Lord Howe Island; Norfolk Island; coral reefs; extinction risk; marine dispersal.
Figures


Similar articles
-
Abundance, diversity, and feeding behavior of coral reef butterflyfishes at Lord Howe Island.Ecol Evol. 2014 Sep;4(18):3612-25. doi: 10.1002/ece3.1208. Epub 2014 Sep 2. Ecol Evol. 2014. PMID: 25478152 Free PMC article.
-
Genetic connectivity among and self-replenishment within island populations of a restricted range subtropical reef fish.PLoS One. 2012;7(11):e49660. doi: 10.1371/journal.pone.0049660. Epub 2012 Nov 21. PLoS One. 2012. PMID: 23185398 Free PMC article.
-
Genetic diversity and connectivity in a brooding reef coral at the limit of its distribution.Proc Biol Sci. 2009 Nov 22;276(1675):3927-35. doi: 10.1098/rspb.2009.1050. Epub 2009 Aug 26. Proc Biol Sci. 2009. PMID: 19710055 Free PMC article.
-
Phylogenetic perspectives on reef fish functional traits.Biol Rev Camb Philos Soc. 2018 Feb;93(1):131-151. doi: 10.1111/brv.12336. Epub 2017 May 2. Biol Rev Camb Philos Soc. 2018. PMID: 28464469 Review.
-
The hidden half: ecology and evolution of cryptobenthic fishes on coral reefs.Biol Rev Camb Philos Soc. 2018 Nov;93(4):1846-1873. doi: 10.1111/brv.12423. Epub 2018 May 7. Biol Rev Camb Philos Soc. 2018. PMID: 29736999 Review.
Cited by
-
Abundance, diversity, and feeding behavior of coral reef butterflyfishes at Lord Howe Island.Ecol Evol. 2014 Sep;4(18):3612-25. doi: 10.1002/ece3.1208. Epub 2014 Sep 2. Ecol Evol. 2014. PMID: 25478152 Free PMC article.
References
-
- Allen GR, Steene R, Allen M. A guide to angelfishes and butterflyfishes. Perth: Odyssey Publishing-Tropical Reef Research; 1998.
-
- Almany GR, Berumen ML, Thorrold SR, Planes S, Jones GP. Local replenishment of coral reef fish populations in a marine reserve. Science. 2007;316:742–744. - PubMed
-
- Bay LK, Choat JH, Robertson L, van Herwerden DR. High genetic diversities and complex genetic structure in an Indo−Pacific tropical reef fish (Chlorurus sordidus), evidence of an unstable evolutionary past? Mar. Biol. 2004;144:757–767.
-
- Beerli P. Effect of unsampled populations on the estimation of population sizes and migration rates between sampled populations. Mol. Ecol. 2004;13:827–836. - PubMed
LinkOut - more resources
Full Text Sources
Other Literature Sources

