. 2013 Jun 18;104(12):2751-63.
doi: 10.1016/j.bpj.2013.05.023.

An excess-calcium-binding-site model predicts neurotransmitter release at the neuromuscular junction

Affiliations

An excess-calcium-binding-site model predicts neurotransmitter release at the neuromuscular junction

Markus Dittrich et al. Biophys J. .

Abstract

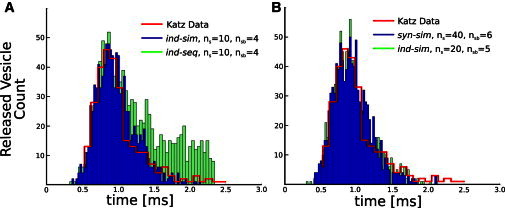
Despite decades of intense experimental studies, we still lack a detailed understanding of synaptic function. Fortunately, using computational approaches, we can obtain important new insights into the inner workings of these important neural systems. Here, we report the development of a spatially realistic computational model of an entire frog active zone in which we constrained model parameters with experimental data, and then used Monte Carlo simulation methods to predict the Ca(2+)-binding stoichiometry and dynamics that underlie neurotransmitter release. Our model reveals that 20-40 independent Ca(2+)-binding sites on synaptic vesicles, only a fraction of which need to bind Ca(2+) to trigger fusion, are sufficient to predict physiological release. Our excess-Ca(2+)-binding-site model has many functional advantages, agrees with recent data on synaptotagmin copy number, and is the first (to our knowledge) to link detailed physiological observations with the molecular machinery of Ca(2+)-triggered exocytosis. In addition, our model provides detailed microscopic insight into the underlying Ca(2+) dynamics during synapse activation.


Figures

Figure 1
Figure 1
Overview of the frog NMJ model. (A) Rendered simulation snapshot of the complete AZ model. Visible are the two double rows of synaptic vesicles (large red spheres) as well as diffusing free and buffer-bound Ca2+ ions (small colored spheres). For visual clarity, unbound buffer sites are not shown. (B and C) Close-ups of synaptic vesicles, revealing the Ca2+-sensor sites at their bottom (the 40-sensor model is shown). The cylindrical glyphs directly in front of synaptic vesicles represent closed or open VGCCs (red, closed; yellow, open). Open VGCCs release Ca2+ ions (yellow spheres) into the presynaptic space, which can bind to endogenous buffer sites (cyan spheres; only Ca2+-bound buffer sites are shown) or sensor sites on synaptic vesicles. Unbound and bound Ca2+-sensor sites on vesicles are colored black and yellow, respectively. (D and E) Important model dimensions (drawings are not to scale).
Figure 2
Figure 2
Experimental and computed whole-cell and single-channel current integrals. (A) The action potential waveform used to drive the voltage-dependent rate constants between closed and open states in our four-state kinetic VGCC model (see inset). (B) Comparison of the experimental and computed whole-cell Ca2+ currents obtained using the action potential and kinetic model shown in panel A. Initial deviations were due to nonlinear leak subtraction of the complex action potential waveform used to activate Ca2+ current. The slightly slower measured deactivation was due to incompletely clamped long neurites extending on either side of the varicose presynaptic bouton. (C) Histogram of the computed single-channel current. (D) Corresponding histogram of the experimental single-channel current from cell-attached patch-clamp recordings in the chick ciliary ganglion. Inset: Sample single-channel openings (bottom trace) evoked by action potential waveforms (top trace). The experimental single-channel currents are larger than the computed ones due to the presence of a high barium concentration in the patch pipette solution (see Supporting Material) (24).
Figure 3
Figure 3
Comparison of vesicle-release latencies. (A) Histograms of vesicle-release latencies for a model with ns = 10 and nsb = 4 for simultaneous (blue, ind-sim) and sequential (green, ind-seq) fusion mechanisms. For comparison, the red graph depicts the data from Katz and Miledi (44) showing that sequential binding leads to a significantly broadened latency distribution. The sudden cutoff in the histogram of the sequential model at 2.35 ms is an artifact due to the 3 ms simulation window and the fact that the histogram was shifted left to overlap with the Katz data (the actual latency extended well beyond 2.35 ms). (B) Latency distribution for ns = 20, nsb = 5 with the ind-sim fusion mechanism, and ns = 40, nsb = 6 with the syn-sim mechanism, both of which agree well with the data from Katz and Miledi (44). See Table 2 legend for definition of ns and nsb.
Figure 4
Figure 4
Computed and measured CRRs. (A–D) Fits for the CRR from simulation data. The inset in each panel shows the arrangement of Ca2+-binding sites on the bottom of synaptic vesicles. (C and D) For the syn-sim fusion mechanism, identically colored regions of five-sensor sites each represent individual synaptotagmin molecules. (A and B) Results for a 10- and 20-sensor arrangement using the ind-sim fusion mechanism. Although the 10-sensor model was not sensitive enough to changes in [Ca2+]ext, the 20-sensor model provided a good match with a CRR of 4.12. (C) Results for a 20-sensor arrangement, nsb = 4, and the syn-sim fusion model, which was too insensitive to changes in [Ca2+]ext with a CRR of 3.65. However, as shown in D, a further increase in the number of available Ca2+-sensor sites to 40, nsb = 6, combined with the syn-sim fusion mechanism led to a model that agreed well both in terms of the CRR (4.65) and the number of released vesicles (nr = 0.49). (E and F) Experimentally measured CRRs. (E) Recordings from a representative NMJ (averages of 15 EPPs each recorded at extracellular Ca2+ concentrations of 0.3, 0.4, 0.5, 0.6, 0.7 mM Ca2+, in order of increasing peak height). (F) Log-log plot and linear regression of the representative data shown in E; the slope of this linear regression is 4.2. When examined in 12 NMJs, the average slope of the linear regression was 4.24 ± 0.76 (mean ± SD). See Table 2 legend for definition of ns, nsb, and nr.
Figure 5
Figure 5
Subvesicular Ca2+ concentration and VGCC contribution to release. (A) Average number and concentration of free Ca2+ in the confined space just below released synaptic vesicles (close to Ca2+-sensor sites, average over ∼4900 release events). Although the Ca2+ concentration can reach micromolar values, the average number of discrete Ca2+ that are present at any given point in time is very small. This emphasizes the extreme sparseness of free Ca2+ and thus the need for an excess of available Ca2+-binding sites on synaptic vesicles to achieve experimentally measured rates of release and CRR. (B) Fractional contribution of increasing numbers of VGCCs to the release of individual synaptic vesicles. The large majority of release events are triggered by Ca2+ ions from one or two Ca2+ channels, highlighting the highly localized (nanodomain (48)) coupling of VGCCs to synaptic vesicles.

Similar articles

Cited by

References

    1. Dodge F.A., Jr., Rahamimoff R. Co-operative action a calcium ions in transmitter release at the neuromuscular junction. J. Physiol. 1967;193:419–432. - PMC - PubMed
    1. Schneggenburger R., Neher E. Intracellular calcium dependence of transmitter release rates at a fast central synapse. Nature. 2000;406:889–893. - PubMed
    1. Bennett M.R., Farnell L., Gibson W.G. The probability of quantal secretion near a single calcium channel of an active zone. Biophys. J. 2000;78:2201–2221. - PMC - PubMed
    1. Shahrezaei V., Cao A., Delaney K.R. Ca2+ from one or two channels controls fusion of a single vesicle at the frog neuromuscular junction. J. Neurosci. 2006;26:13240–13249. - PMC - PubMed
    1. Bollmann J.H., Sakmann B. Control of synaptic strength and timing by the release-site Ca2+ signal. Nat. Neurosci. 2005;8:426–434. - PubMed

Publication types

LinkOut - more resources