. 2013 Jun 20;153(7):1494-509.
doi: 10.1016/j.cell.2013.05.026.

PI(4,5)P(2)-dependent and Ca(2+)-regulated ER-PM interactions mediated by the extended synaptotagmins

Affiliations

PI(4,5)P(2)-dependent and Ca(2+)-regulated ER-PM interactions mediated by the extended synaptotagmins

Francesca Giordano et al. Cell. .

Abstract

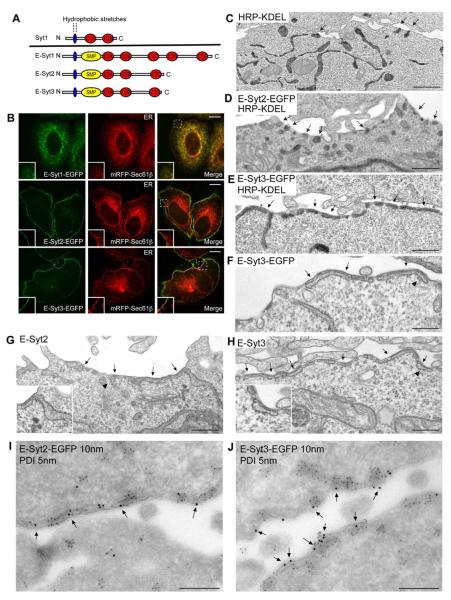
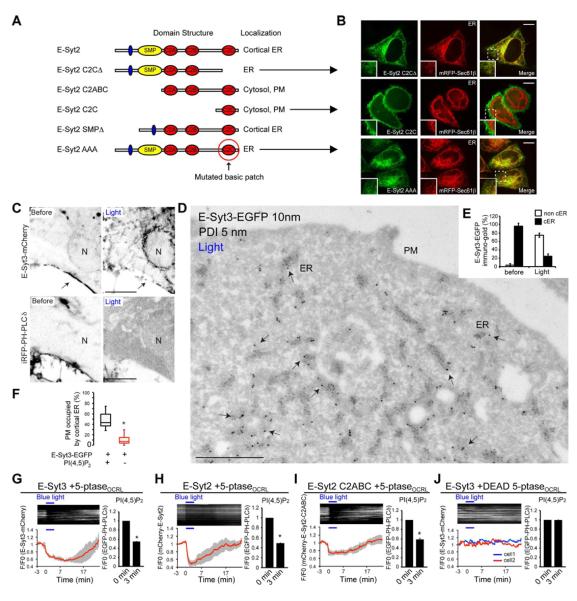
Most available information on endoplasmic reticulum (ER)-plasma membrane (PM) contacts in cells of higher eukaryotes concerns proteins implicated in the regulation of Ca(2+) entry. However, growing evidence suggests that such contacts play more general roles in cell physiology, pointing to the existence of additionally ubiquitously expressed ER-PM tethers. Here, we show that the three extended synaptotagmins (E-Syts) are ER proteins that participate in such tethering function via C2 domain-dependent interactions with the PM that require PI(4,5)P2 in the case of E-Syt2 and E-Syt3 and also elevation of cytosolic Ca(2+) in the case of E-Syt1. As they form heteromeric complexes, the E-Syts confer cytosolic Ca(2+) regulation to ER-PM contact formation. E-Syts-dependent contacts, however, are not required for store-operated Ca(2+) entry. Thus, the ER-PM tethering function of the E-Syts (tricalbins in yeast) mediates the formation of ER-PM contacts sites, which are functionally distinct from those mediated by STIM1 and Orai1.


Figures

Figure 1
Figure 1. Localization of the E-Syts in the ER and of E-Syt2 and E-Syt3 at ER-PM contact sites
(A) Domain structure of Syt1, and of the E-Syts. (B) Confocal images of HeLa cells expressing E-Syt-EGFP fusions and the ER marker mRFP-Sec61β. Insets show at higher magnification the colocalization throughout the ER for E-Syt1, but only colocalization with the ER marker at the cell periphery for E-Syt2 and E-Syt3. Scale bar, 10 μm. (C–H) Electron micrographs of HeLa cells transfected with the ER luminal marker HRP-KDEL alone (C), or together with E-Syt2-EGFP (D) or E-Syt3-EGFP (E). Cells singly transfected with E-Syt3-EGFP (F), untagged E-Syt2 (G) or untagged E-Syt3 (H). The ER can be identified via an electron dense (dark) HRP reaction product in C–E, and by presence of ribosomes (arrowheads) in F–H. Arrows in C–H indicate cortical ER. Scale bar, 250 nm. (I–J) Electron micrographs of ultrathin cryosections of HeLa cells transfected with E-Syt2-EGFP (I) or E-Syt3-EGFP (J) and double immunogold labeled for EGFP (10 nm gold) to detect E-Syts and for endogenous PDI (5 nm gold) to label the ER lumen. E-Syt2 and E-Syt3 are almost exclusively localized to the cortical ER (arrows). Scale bar, 200nm. See also Figure S1.
Figure 2
Figure 2. Comparison of the accessibility of the N-termini of Syt1 and of the E-Syts to the extracellular space
(A) Confocal images of live HeLa cells expressing Syt1-EGFP and mRFP-Sec61β showing the predominant PM localization of Syt1 in these cells. Bottom images: high power view of the region outlined by dotted lines in the merge field. (B–E) Fluorescent images of HeLa cells co-expressing mRFP-Sec61β and Myc-Syt1 or Myc-E-Syts as indicated, and incubated with anti-Myc antibodies. The Myc epitope was accessible in the case of Myc-Syt1 but not in the case of Myc-E-Syts. (F) Fluorescent images of SH-SY5Y neuroblastoma cells co-expressing mRFP-Sec61β (red) with either Myc-Syt1 or Myc-E-Syts (green) and incubated with anti-Myc antibodies before fixation (left panels, “surface”) or after fixation and permeabilization (right panel, “permeabilized”). See also Figure S1.
Figure 3
Figure 3. E-Syts are inserted into the ER membranes via hydrophobic hairpin sequences
(A) Alignments of putative transmembrane regions of the three E-Syts (human) and of the three tricalbins. The uncharged residues are contained in the red boxes. Conserved residues and substitutions are shaded in dark and light grey, respectively. The numbers on the right refer to the position of the last residue shown in each sequence. (B–D) Fluorescence images of digitonin-permeabilized (20 μM) HeLa cells co-expressing Myc-E-Syts and ER-mRFP and incubated with Alexa Fluor 488-conjugated anti-Myc antibodies (green) before fixation, showing accessibility of N-terminal Myc epitopes at the surface of ER elements. At the concentration of digitonin used, ER membranes remain unpermeabilized although vesiculated due to cell lysis (see also Figure S2). Scale bar, 10 μm. (E) Cell-free translation-translocation assays showing translocation across microsomal membranes of the N-terminus of Syt1 but not of E-Syt3. (Left panel) Analysis of [35S]Met-labeled Myc-Syt1 and Myc-E-Syt3 translated in vitro in the presence or absence of dog pancreas rough microsomes (RM) and N-glycosylation tripeptide inhibitor (NYT), as indicated. An asterisk indicates glycosylated Syt1. (Right panel) Results of protease protection assay. After translation, an aliquot of each fraction was immunoprecipitated with anti-Myc antibodies (upper panel). A ten fold larger aliquot of each sample was subjected to proteinase K (PK) digestion before immunoprecipitation (lower panel). (F) Schematic cartoon showing the topology of Syt1 and of the E-Syts suggested by these experiments. The hydrophobic stretches (about 30 amino acids) previously predicted to cross the membrane are proposed to form hairpins in the ER bilayer. See also Figure S2.
Figure 4
Figure 4. Interaction of the C2C domains of E-Syt2/3 with PM PI(4,5)P2 is required for the ER-PM tethering function of E-Syt2/3
(A) E-Syt2 constructs examined and their localizations. (B) Confocal images of HeLa cells of constructs lacking the C2C domain or mutated in the basic patch in this domain. The C2C domain alone is targeted to the cell cortex. Scale bar, 10μm. (C) Confocal images of a COS-7 cell expressing E-Syt3-mCherry, the PI(4,5)P2 reporter iRFP-PH-PLCδ1, and the two components of blue light-dependent PI(4,5)P2 depletion system at the end of 10 min blue light illumination (arrow indicates cortical ER). Fluorescence is shown in black. N = nucleus. (see also movie S3). Scale bar, 5μm. (D–F) Immuno-EM micrograph (E-Syt3-EGFP, 10nm gold and endogenous PDI, 5nm gold) of cells processed as above and fixed at the end of the illumination. Quantification of the results is shown in E and F. Note that the redistribution of E-Syt3-EGFP from cell periphery (cortical ER, cER) (compare with Figure 1J) into the non-cortical ER (arrows) is accompanied by loss of cER (mean±SD) (F). * P<0.001. (G – J) Time-course of normalized mCherry fluorescence, as assessed by TIRF microscopy, from COS-7 cells expressing the indicated E-Syt fusion proteins together with EGFP-PH-PLCδ1 and the two components of blue light-dependent PI(4,5)P2 depletion system (G – I) or the same two components but with a catalytically inactive phosphatase domain (DEAD 5-ptaseOCRL) (J). (Top) kymographs of representative cells, and (bottom) average traces (n=5). Data are represented as mean±SEM. The bar graphs on the right show levels of PI(4,5)P2, as assessed by EGFP-PH-PLCδ1 fluorescence at time zero and at the end of the 3 min illumination. * P<0.001. See also Figure S3.
Figure 5
Figure 5. E-Syt1 makes dynamic contacts with the PM in a Ca2+- and PI(4,5)P2-dependent manner
(A) TIRF microscopy images of a HeLa cell expressing EGFP-E-Syt1 before and after stimulation with 2μM thapsigargin (TG) at the indicated times. Scale Bar, 10 μm. (B) Time-course of TG-induced recruitment of EGFP-E-Syt1 to the PM, as shown in A (mean±SEM, n=5). (C) Immuno-EM micrographs of HeLa cells expressing E-Syt1-EGFP, untreated or treated with TG (2 μM, 10 s). E-Syt1-EGFP (10nm gold) and endogenous PDI (5nm gold). Arrows indicate E-Syt1-positive non-cortical ER and arrowheads indicate E-Syt1-positive cortical ER (magnified in the inset). Scale bar, 200 nm. Quantification of the results is shown in D. (means±SD). (E) Quantification of the response of wild-type (WT) or Ca2+-binding deficient (Mut) mCherry-E-Syt1 to TG (2 μM, peak response) in HeLa cells, as assessed by TIRF microscopy, with or without optogenetic depletion of PM PI(4,5)P2 (mean±SEM, n=3 for each, * P<0.001 for comparison to WT [TG]). (F) Confocal images of the ventral region of COS-7 cells expressing WT or Mut mCherry-E-Syt1 before and 10 s after UV photolysis of caged Ca2+ with or without optogenetic depletion of PM PI(4,5)P2. Hot spots of fluorescence represent focal accumulation of E-Syt1 at the PM. (G) Time-course of results shown in F (mean±SEM, n=7–15, * P<0.01 compared to no PI[4,5]P2). (H) TIRF microscopy images of a HeLa cell expressing E-Syt1-EGFP and the M1 muscarinic receptor (M1R) before and after stimulation with 10 μM oxotremorine-M (Oxo-M). (Bottom) Kymograph of EGFP fluorescence of a representative cell. Fluorescence in A, F and H is shown in black. See also Figure S4.
Figure 6
Figure 6. Heteromerization of the E-Syts
(A) Confocal images of HeLa cells co-expressing pairs of EGFP and mCherry E-Syts as indicated. Scale bar, 10 μm. Insets show at higher magnification of the areas framed by a dotted line. (B) Immuno-EM micrograph of HeLa cells co-expressing E-Syt3-FLAG (15nm gold) and EGFP-E-Syt1 (10nm gold and arrows). Scale bar, 200nm. (C) Quantification of immunogold labeling for E-Syt1 on the non-cortical portion of the ER (non-cER) and at ER-PM contact sites (cER) of cells expressing EGFP-E-Syt1 alone or together with 3xFLAG-E-Syt2 or E-Syt3-MycFLAG. Data are represented as mean. (D – E) Time-course of normalized mCherry and EGFP fluorescence, as assessed by TIRF microscopy, from HeLa cells expressing E-Syt2-mCherry and EGFP-PH-PLCδ1 together with M1R. Cells were treated with either control siRNA (D) or siRNA specific for E-Syt1 (E) and stimulated with Oxo-M (10 μM), followed by addition of atropine (50 μM), as indicated (mean±SEM). (F) Quantification M1 muscarinic receptor of fluorescence corresponding to the peak of E-Syt2 recruitment [arrows in the traces of (D) and (E)] (mean± SEM; * P<0.001). (G – H) Time-course of normalized mCherry fluorescence (TIRF) from HeLa cells expressing mCherry-E-Syt1 alone or together with Myc-E-Syt2. (H) Quantification of fluorescence corresponding to Peak (P) and Drop (D) in the traces of (G) (mean± SEM). (I – J) Extracts of HeLa cells transfected with the constructs indicated were subjected to anti-GFP immunoprecipitation (IP) and then processed for SDS-PAGE and immunoblotting (IB) with anti-GFP, anti-E-Syt1 (I) or anti-E-Syt3 (J) antibodies. Arrows indicate the co-immunoprecipitated bands. Inputs are 2.5% of the total cell lysates. (K) Lysates of HeLa cells expressing EGFP-TEV-3xFLAG-E-Syt2 were tandem affinity purified (TAP) using anti-GFP and anti-FLAG antibodies. Colloidal blue staining of gels of the starting extract (0.5%) and of the affinity-purified material is shown. See also Figure S5.
Figure 7
Figure 7. Knockdown of the E-Syts decreases the number of ER-PM contacts but does not impair SOCE
(A) EM micrographs of HRP-KDEL-expressing HeLa cells treated with control siRNA (Ctrl) or siRNAs against the three E-Syts (TKD). Red arrows indicate ER-PM contact sites. N = nucleus. (B) The percentage of PM length engaged in contacts is shown as box and whisker plot (* P<0.001). (C) Time-course of the normalized GFP signal, as assessed by TIRF microscopy, from a HeLa cell expressing a luminal ER marker (ER-oxGFP) and M1R. Oxo-M (10 μM) stimulation and atropine (50 μM) addition are indicated. (D – F) Dynamics of the cortical ER, as visualized by ER-oxGFP fluorescence in the TIRF field, in response to Oxo-M, in control or TKD cells co-expressing the PM marker pm-mRFP and M1R. For rescue, TKD cells were transfected with RNAi-resistant E-Syt1 and E-Syt2. Representative kymographs of the GFP fluorescence (black) and time-course of the normalized ER-oxGFP/pm-mRFP ratios are shown in (D) and (E), respectively. (F) Quantification of fluorescence corresponding to the peaks in E (n=3–10 for each condition). (G) TIRF microscopy images of HeLa cells co-expressing EGFP-E-Syt1 and mRFP-STIM1 before and after the addition of TG (2μM). (H) Time-course of the recruitment of EGFP-E-Syt1 (top) and mRFP-STIM1 (bottom) to the PM. (I) Fura-2 Ca2+-recordings of control and TKD cells. (Left) Time-course of the normalized F340/F380 ratios of cells exposed to TG (2μM) in Ca2+-free medium, followed by Ca2+ add-back. The first response corresponds to Ca2+ leak from the ER, while the second response corresponds to Ca2+ entry from the extracellular medium (SOCE). (Right) SOCE peak values (mean± SEM, n=9 (Ctrl) and n=8 (TKD), n.s.; not significant). (J) EM micrographs of control and TKD cells expressing HRP-STIM1 (dark staining) show cortical ER (cER) upon treatment with TG (2μM). Red arrows delimitate cER with a “thin” lumen. Black arrow indicate “wide” lumen. (K) Immuno-EM micrographs of TG (2 μM) treated control and TKD cells transfected with YFP-STIM1 (anti-GFP, 10nm gold) (arrowheads). Note the exclusion of PDI (5 nm gold) (black arrows) from the “thin” ER (delimited by red arrows) that is preserved in TKD cells. Scale bar, 250 nm. (L) The percentages of PM length in EM sections which is lined by the cortical ER (total), and by the “thin” and “wide” portions of such ER are shown as Box and whisker plot (* P<0.001). (M) (Left) Pie graphs showing the percentages of the “thin” and the “wide” lumen cER. (Right) Box and whisker plot showing that the relative proportion of the “wide” lumen cER is preferentially decreased in TKD cells (* P<0.001).

Comment in

References

    1. Anderie I, Schulz I, Schmid A. Characterization of the C-terminal ER membrane anchor of PTP1B. Experimental cell research. 2007;313:3189–3197. - PubMed
    1. Block BA, Imagawa T, Campbell KP, Franzini-Armstrong C. Structural evidence for direct interaction between the molecular components of the transverse tubule/sarcoplasmic reticulum junction in skeletal muscle. The Journal of cell biology. 1988;107:2587–2600. - PMC - PubMed
    1. Brambillasca S, Yabal M, Soffientini P, Stefanovic S, Makarow M, Hegde RS, Borgese N. Transmembrane topogenesis of a tail-anchored protein is modulated by membrane lipid composition. The EMBO journal. 2005;24:2533–2542. - PMC - PubMed
    1. Cahalan MD. STIMulating store-operated Ca(2+) entry. Nature cell biology. 2009;11:669–677. - PMC - PubMed
    1. Chapman ER. How does synaptotagmin trigger neurotransmitter release? Annual review of biochemistry. 2008;77:615–641. - PubMed

Publication types

MeSH terms