. 2013 Jun 20;153(7):1537-51.
doi: 10.1016/j.cell.2013.05.028.

Jpx RNA activates Xist by evicting CTCF

Affiliations

Jpx RNA activates Xist by evicting CTCF

Sha Sun et al. Cell. .

Abstract

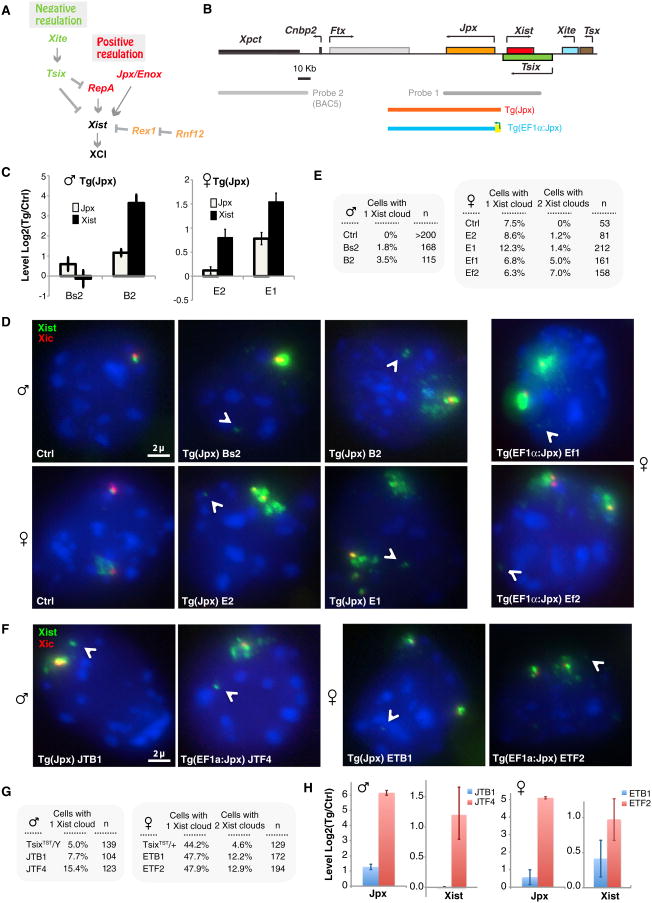
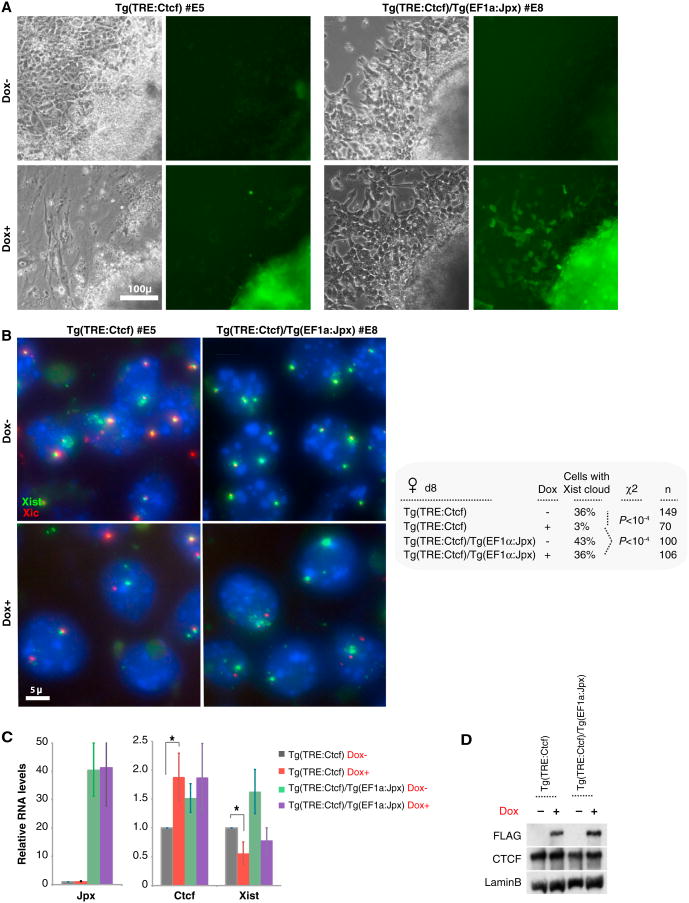
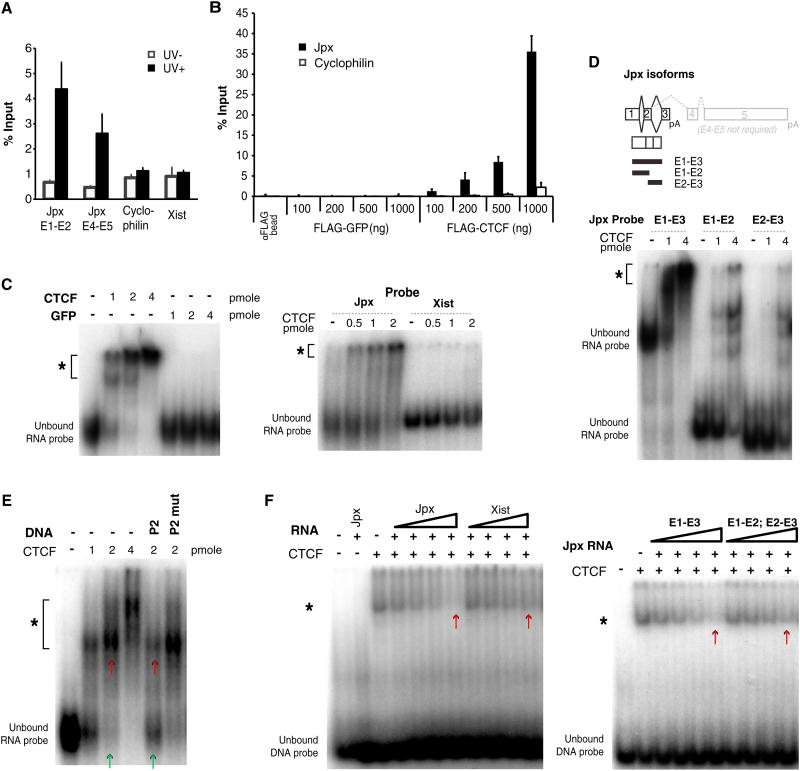
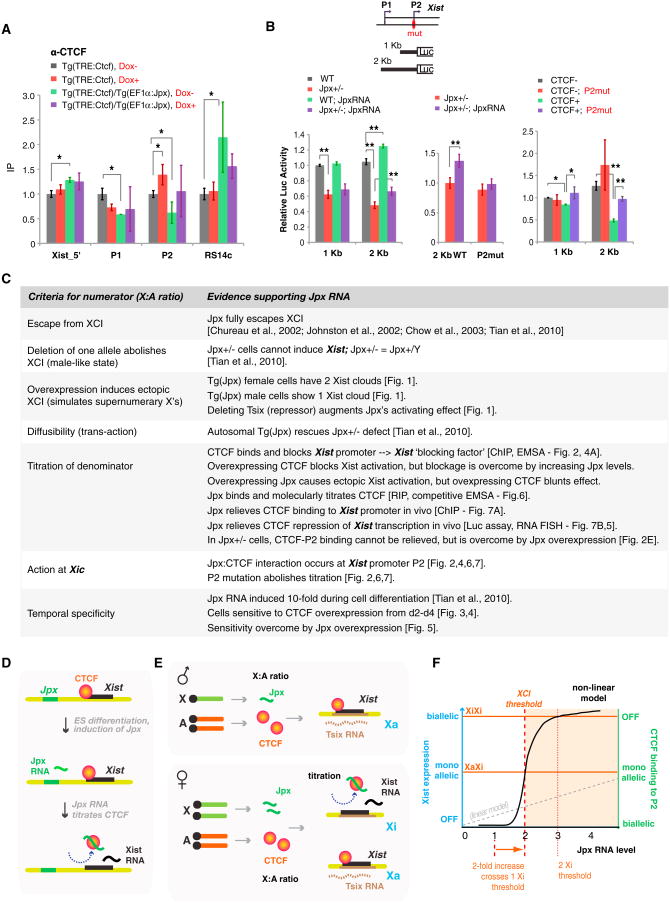
In mammals, dosage compensation between XX and XY individuals occurs through X chromosome inactivation (XCI). The noncoding Xist RNA is expressed and initiates XCI only when more than one X chromosome is present. Current models invoke a dependency on the X-to-autosome ratio (X:A), but molecular factors remain poorly defined. Here, we demonstrate that molecular titration between an X-encoded RNA and an autosomally encoded protein dictates Xist induction. In pre-XCI cells, CTCF protein represses Xist transcription. At the onset of XCI, Jpx RNA is upregulated, binds CTCF, and extricates CTCF from one Xist allele. We demonstrate that CTCF is an RNA-binding protein and is titrated away from the Xist promoter by Jpx RNA. Thus, Jpx activates Xist by evicting CTCF. The functional antagonism via molecular titration reveals a role for long noncoding RNA in epigenetic regulation.


Figures

Figure 1
Figure 1. Jpx Overexpression Results in Ectopic Xist Upregulation
(A) Positive-negative regulation of Xist. Arrows, activation; blunt arrows, repression. (B) Map of Xic, FISH probes, and Jpx transgenes. Tg(Jpx). (C) Quantitation of Jpx and Xist expression on d4 in Tg(Jpx) ES cells by qRT-PCR. Representative independent clones (male Bs2, B2; female E2, E1) are shown. Expression levels normalized to ctrl (control clone). Averages ± SE. See also Figure S1. (D) Xist expression examined by RNA-DNA FISH in d4 ES cells. FITC (green, probe 1), Xist RNA cloud. Cy3 (red), BAC5 probe 2 marks Xic. Arrowheads, Tg insertion site. (E) Quantitation of Xist RNA-DNA FISH results in d4 ES cells. Representative clones shown. n, sample size. See also Figure S1. (F) Disabling Tsix augments Xist's response to Jpx overexpression. RNA-DNA FISH of Tg(EF1a:Jpx) cells in a TsixTST/Y or TsixTST/+ cells on d4 of differentiation. One representative clone shown for each. FITC (green, probe 1), Xist RNA cloud. Cy3 (red), BAC5 probe 2 marks Xic. Arrowheads, Tg insertion site. (G) Quantitation of cells (in F) with the Xist pattern indicated. (H) qRT-PCR of Xist and Jpx RNA levels on d4, normalized to RNA levels in parental TsixTST/Y or TsixTST/+ cells. Averages ± SE. See also Figure S1.
Figure 2
Figure 2. CTCF Binding to theXistPromoter Is Anticorrelated with Xist Expression
(A)Xist P1 and P2 promoters, CTCF sites, and EMSA probes. Red, CTCF motif. Green bases, nonconforming CTCF motif. Blue, mutated bases in EMSA probes. (B) DNA EMSA using indicated probes with recombinant CTCF or GFP protein. *, DNA-protein shift. (C) CTCF ChIP quantitative PCR analysis on d0, d3, and d6 ES cells as indicated. Rnf12, negative control; RS14c and H19, positive controls. At least three independent experiments were performed for each time point. Averages ± SE. (D) Allele-specific ChIP for CTCF at Xist P2 site in TsixTST/+ female ES cells. cas, M. castaneus. mus, M. musculus. Two independent experiments in triplicates were performed for each time point. Averages ± SE. (E) CTCF ChIP on d0, d3, and d6 female Jpx+/− ES cells. Three independent experiments were performed for each time point. Averages ± SE. P, one-way t test comparing d0 versus d3 and d6 for each site.
Figure 3
Figure 3. CTCF Overexpression Results in Female-Specific EB Outgrowth Defect
(A) Dox-inducible bidirectional expression of CTCF-3xFLAG and GFP in rtTA-expressing MEF. Normal cell morphology shown by phase-contrast before (Dox—) and after (Dox+) induction of GFP and CTCF. FLAG and CTCF immunofluorescence shown. (B) Western blot of representative transgenic clones shows dox-induction of CTCF-3xFLAG in d0 ES cells (left panel) and d1 female ES cells (right panel). (C) CTCF overexpression results in female-specific defect in outgrowth up to d13. Bright field images show EB outgrowth. GFP indicates transgene (CTCF) overexpression. Note GFP-positive cells in male, but not female, outgrowth in Dox+ condition. After induction, GFP signals are confined to the EB center. (D) Female control, ctrl#5, carries a silenced transgene and grows normally, whereas overexpressers, clones #2 and #1, fail to outgrow. d5 images shown.
Figure 4
Figure 4. CTCF Overexpression Inhibits Xist Induction in a Temporally Sensitive Manner
(A) CTCF overexpression blocks Xist upregulation. Left panel: RNA-DNA FISH on d6 female transgenic cells±Dox. Green, Xist RNA. Red, Xiclocus. Middle panel: Quantitation of Xist clouds ± Dox on d6 for two clones. Only full Xist clouds are scored (not pinpoint signals). Right panel: qRT-PCR on d4 cells for Oct4, Bmp4, and Xist RNA. Averages ± SE. (B) Sensitive time window between d2–d4 of EB differentiation. Dox is applied on the days indicated (red bar) during time course analysis. Phase contrast and corresponding GFP images are shown for d11.
Figure 5
Figure 5. Jpx RNA Neutralizes the Outgrowth Defect by Titrating CTCF
(A) Overexpressing Jpx RNA rescues outgrowth defects caused by CTCF overexpression. Phase contrast and corresponding GFP signals shown on d8 of differentiation. (B) RNA-DNA FISH on d8. Green, Xist RNA; red, Xic locus. FISH counts are shown in the right panel. (C) qRT-PCR of Jpx, Xist, and Ctcf RNA on d8, normalized to Tg(TRE:Ctcf) Dox– (set to 1.0). Averages ± SE of triplicates. *p < 0.05 (one-way t test). (D) CTCF-FLAG induction shown by western blotting.
Figure 6
Figure 6. Jpx RNA Binds to CTCF and Extricates CTCF from the Xist Promoter
(A) UV-RIP using anti-FLAG antibodies, followed by qRT-PCR in d12 female ES cells. qRT-PCR was performed on Jpx exons 1–2 (E1–E2), exons 4–5 (E4–E5), Cyclophilin control, and Xist. UV-negative controls were processed in parallel. Averages ± SE. (B) In vitro RNA pull-down using total RNA extracted from wild-type female MEFs. Purified FLAG-GFP or -CTCF was incubated with RNA. Pull-downs quantified by qRT-PCR. Averages ± SE. (C) RNA EMSA. *, RNA-protein shift. Left panel: Jpx RNA probe (383 nt) with increasing amounts of purified CTCF or GFP. Right panel: CTCF with Jpx versus 383 nt Xist control probe. (D) RNA EMSA using Jpx isoforms. E1–E3, 383 nt (full length). Truncated E1–E2, 220 nt, or E2–E3, 183 nt. E4–E5 are alternative 3′ ends, which are not required for Xist activation (Lee et al., 1999). (E) Titration EMSA shows that Jpx RNA and P2 DNA compete for binding to CTCF. A 0.5 pmol of Jpx probe, with 2 pmol cold P2 or P2 mut 80 bp DNA competitor. *, RNA-protein shift. Compare lanes marked by green/red arrows. (F) Reciprocal titration: P2 DNA and Jpx RNA compete for binding to CTCF. CTCF and P2 DNA probe were mixed with cold RNA competitor at 0.1, 0.2, 0.4, and 0.8 μg. *, DNA-protein shift. Left panel: With cold Jpx RNA or Xist RNA competitor. Right panel: With full-length Jpx versus truncated Jpx RNA competitor. Compare lanes marked by red arrows.
Figure 7
Figure 7. Jpx RNA and CTCF Titrate Each Other at the Xist Promoter In Vivo
(A) In vivo titration shown by CTCF ChIP analysis on transgenic female ES cells at d0. Enrichment values were normalized against H19 control and compared to Tg(TRE:Ctcf) Dox– (set to 1.0) for each site using a one-way t test (*p < 0.05). At least three independent experiments were performed for each cell line. Averages ± SE. (B) Titration and modulation of Xist P1+P2 transcription shown by luciferase assays in d4 female ES cells of indicated genotypes. Map of Xist's 5′ end is shown with luciferase constructs. Left panel: Jpx overexpression achieved by Tg(EF1 a:Jpx) in Jpx+/— mutants rescues Xist promoter activity. Middle panel: Rescue is abolished by mutating P2. Right panel: Transcription repression caused by overexpressing CTCF is relieved by mutating P2. CTCF+, CTCF overexpression induced by Dox via Tg(TRE:Ctcf). At least two independent transfections and ≥4 independent luciferase measurements were performed for each experiment. Averages ± SE. *p < 0.05. **p < 0.01. (One-tail t tests in the pairwise comparison indicated.) (C) Summary of data supporting the Jpx-CTCF titration model. (D) Model: Jpx RNA activates Xist by extricating CTCF from the Xist promoter. (E) X:A titration: BF, blocking factor. CF, competence factor. The precise composition of BF and its Xic binding site is currently unknown. CTCF may be a component of BF. Jpx forms CF only when present in 2-fold excess. (F) Nonlinear dynamics would be a necessary property of the titration model, most probably effected by highly cooperative interactions. A sigmoidal binding curve would enable small changes in factor concentration to elicit large biological effects (e.g., all or none binding), in a way not possible with linear dynamics (broken gray line).

Comment in

References

    1. Augui S, Nora EP, Heard E. Regulation of X-chromosome inactivation by the X-inactivation centre. Nat Rev Genet. 2011;12:429–442. - PubMed
    1. Barakat TS, Gunhanlar N, Pardo CG, Achame EM, Ghazvini M, Boers R, Kenter A, Rentmeester E, Grootegoed JA, Gribnau J. RNF12 activates Xist and is essential for X chromosome inactivation. PLoS Genet. 2011;7:e1002001. - PMC - PubMed
    1. Barbash DA, Cline TW. Genetic and molecular analysis of the autosomal component of the primary sex determination signal of Drosophila melanogaster. Genetics. 1995;141:1451–1471. - PMC - PubMed
    1. Bell AC, West AG, Felsenfeld G. The protein CTCF is required for the enhancer blocking activity of vertebrate insulators. Cell. 1999;98:387–396. - PubMed
    1. Blais A, Tsikitis M, Acosta-Alvear D, Sharan R, Kluger Y, Dynlacht BD. An initial blueprint for myogenic differentiation. Genes Dev. 2005;19:553–569. - PMC - PubMed

Publication types